Last Updated On : 17-Jul-2026
Total 122 Questions
Refer to the exhibit.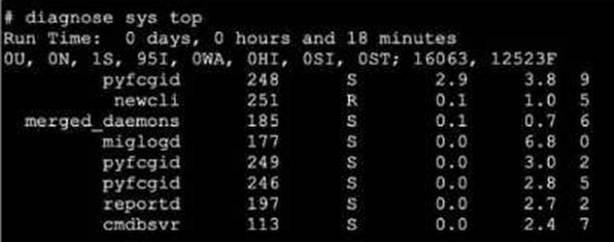
A. The miglogd daemon is running on CPU core ID 0.
B. The diagnose sys top command has been running for 18 minutes.
C. The miglogd daemon would be on top of the list, if the administrator pressed m on the keyboard.
D. The cmdbsvr process is occupying 2.4% of the total user memory space.
E. If the neweli daemon continues to be in the R state, it will need to be manually restarted.
Explanation:
This question evaluates the technical skill of interpreting the FortiOS diagnostic output for system processes. It focuses on identifying process states, resource consumption (CPU/Memory), and the interactive commands available to manage the live display.
✅ Correct Option A:
The final column in the output display represents the CPU core ID assigned to the process. For the miglogd entry, the value shown is 0. This confirms that the daemon is currently executing on the first CPU core, which is essential information when diagnosing multi-core performance or process distribution.
✅ Correct Option C:
The diagnostic output defaults to sorting by CPU usage. However, the tool is interactive; pressing the "m" key reorders the list based on memory consumption. Because miglogd has the highest memory usage in the exhibit at 6.8%, it would shift to the top of the list after the sort.
✅ Correct Option D:
The column located second from the right indicates the percentage of total system memory utilized by a process. For the cmdbsvr process, the value is explicitly listed as 2.4. This confirms it is using that exact percentage of the available memory resources at the time of the diagnostic.
❌ Incorrect Option B:
The "Run Time" header at the top of the exhibit reflects the total system uptime since the FortiGate was last booted. It does not represent the amount of time the specific diagnostic command has been active, which is a common misconception when reading these system headers.
❌ Incorrect Option E:
In the state column, "R" stands for "Running," meaning the process is actively executing or ready to execute on the CPU. This is the expected state for an active daemon like newcli and does not indicate a crash, hang, or any need for a manual intervention.
🔧 Reference:
→ FortiGate Troubleshooting
This guide confirms the process state definitions, the meaning of each output column (including CPU core ID), and the interactive shortcuts used to sort data.
Exhibit.
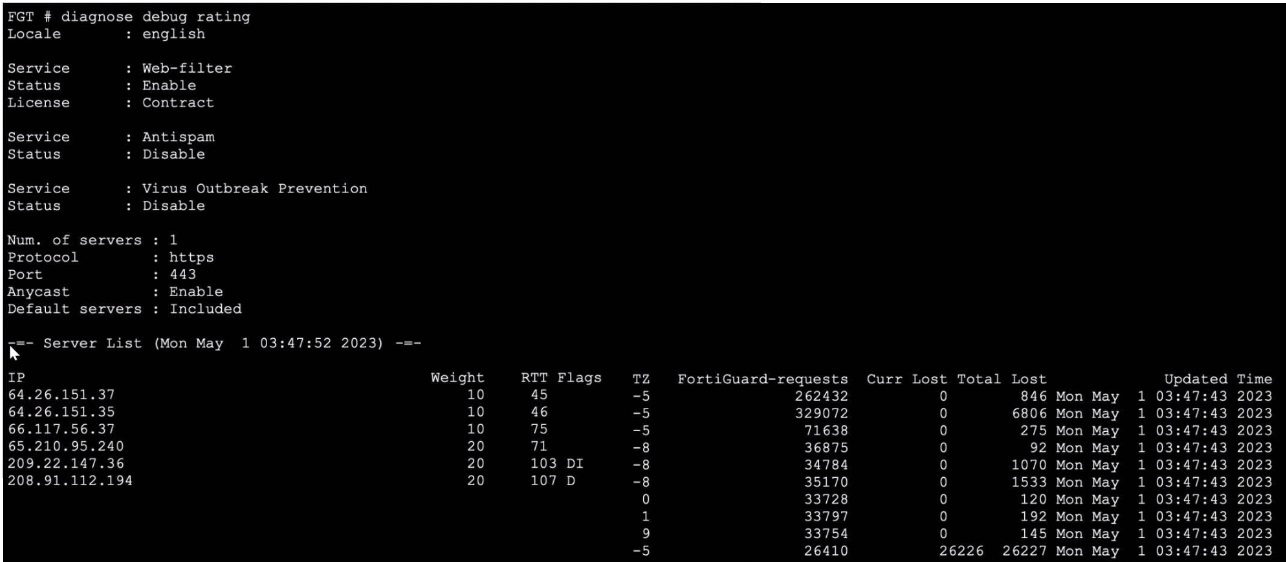
Refer to the exhibit, which shows the output of a diagnose command.
What can you conclude about the debug output in this scenario?
A. The first server provided to FortiGate when it performed a DNS query looking for a list of rating servers, was 121.111.236.179.
B. There is a natural correlation between the value in the FortiGuard-requests field and the value in the Weight field.
C. FortiGate used 64.26.151.37 as the initial server to validate its contract.
D. Servers with a negative TZ value are less preferred for rating requests.
Explanation:
This question tests the ability to interpret the diagnose debug rating output on FortiGate, which displays FortiGuard rating server details including RTT, Weight, Flags, TZ, and request counts. Understanding how FortiGate selects and prioritizes rating servers is critical for troubleshooting FortiGuard connectivity and contract validation.
✅ Correct Answer:
✔️ Option C: FortiGate used 64.26.151.37 as the initial server to validate its contract.
FortiGate selects the server with the lowest RTT (Round Trip Time) as the most preferred server for initial communication, including contract validation. In the output, 64.26.151.37 holds the lowest RTT of 45ms among all listed servers, making it the first server FortiGate contacted to validate its FortiGuard license contract.
❌ Incorrect Answers:
❌ Option A: The first server provided to FortiGate when it performed a DNS query looking for a list of rating servers, was 121.111.236.179.
The IP 121.111.236.179 does not appear anywhere in the exhibited output. The server list only contains IPs in the 64.x, 65.x, 66.x, 208.x, and 209.x ranges. This option references a completely fabricated IP address with no basis in the displayed data, making it entirely invalid.
❌ Option B: There is a natural correlation between the value in the FortiGuard-requests field and the value in the Weight field.
The relationship is actually inverse, not a natural/direct correlation. Servers with Weight 10 (more preferred) receive significantly more requests (262K–329K), while Weight 20 servers receive far fewer (34K–36K). Higher weight = lower preference = fewer requests — the opposite of a natural positive correlation.
❌ Option D: Servers with a negative TZ value are less preferred for rating requests.
All servers in the output have negative TZ values (−5 or −8), representing their timezone offsets — not a preference indicator. Server preference in FortiGuard is determined by RTT and Weight, not TZ. Since every listed server has a negative TZ, this field cannot logically differentiate server preference.
🔧 Reference:
➡️ FortiGate Administration Guide – FortiGuard Distribution Network
→ Confirms how FortiGate selects rating servers based on RTT and Weight, and how contract validation works with the preferred lowest-RTT server.
➡️ Fortinet Community – How to interpret diagnose debug rating
→ Explains each column (RTT, Weight, TZ, Flags, FortiGuard-requests) and clarifies that TZ is a timezone offset, not a server preference metric.
Which statement about parallel path processing is correct (PPP)?
A. PPP chooses from a group of parallel options lo identity the optimal path tor processing a packet.
B. Only FortiGate hardware configurations affect the path that a packet takes.
C. PPP does not apply to packets that are part of an already established session.
D. Software configuration has no impact on PPP.
Explanation:
Parallel Path Processing (PPP) is a FortiOS mechanism that evaluates multiple processing paths in parallel to determine the most efficient route for handling a packet. It uses firewall policy configuration and UTM/NGFW feature sets to decide how traffic should be processed — whether through fast-path offloading (via CP processors) or deep inspection paths.
PPP is triggered during the first packet of a session, where FortiOS evaluates all applicable paths (e.g., IPS, AV, DLP, App Control) and selects the optimal one based on policy and hardware acceleration availability.
Once a session is established, subsequent packets follow the chosen path, meaning PPP is not re-evaluated for those packets.
❌ Why the other options fail:
B. Only FortiGate hardware configurations affect the path:
Incorrect. While hardware (CP8/CP9) influences acceleration, software configuration (firewall policies, UTM profiles) directly determines which path PPP selects.
C. PPP does not apply to packets that are part of an already established session:
Technically true, but misleading. PPP does apply to the first packet, which is the critical decision point. This option is a distractor.
D. Software configuration has no impact on PPP:
False. Firewall policies and UTM settings are central to PPP, as they define which inspection engines are invoked.
📖 Reference:
Fortinet Docs –
Parallel Path Processing (Life of a Packet)
Exhibit.
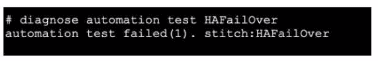
Refer to the exhibit, which shows the output of diagnose automation test.
What can you observe from the output? (Choose two.)
A. The automation stitch test is not being logged.
B. The automation stitch test failed but the HA failover was successful.
C. An HA failover occurred.
D. The test was unsuccessful.
Explanation:
The output shows the diagnostic command diagnose automation test HAFailover returned the result automation test failed(1). This indicates the automation stitch test itself failed to execute properly. Furthermore, the diagnostic output does not show any subsequent log messages that would normally be generated by a successful stitch execution. Therefore, the test was unsuccessful, and the stitch is not being logged due to the failure.
Why the Other Options are Incorrect:
B. The automation stitch test failed but the HA failover was successful.
This is incorrect. The diagnostic command only tests the automation stitch named "HAFailover". It does not trigger, monitor, or confirm an actual HA failover event. The output explicitly states the test failed; it makes no statement about the success of a real failover.
C. An HA failover occurred.
This is false. The diagnose automation test command is a troubleshooting tool to validate the logic and triggering of an automation stitch configuration. It simulates the stitch's conditions and actions in a test environment. It does not execute the actual actions (like forcing an HA failover). No failover occurred.
Reference:
FortiOS Automation Stitches:
These are configured triggers and actions. The diagnose automation test
What are two functions of automation stitches? (Choose two.)
A. You can configure automation stitches on any FortiGate device in a Security Fabric environment.
B. You can configure automation stitches to execute actions sequentially by taking parameters from previous actions as input for the current action.
C. You can set an automation stitch configured to execute actions in parallel to insert a specific delay between actions.
D. You can create automation stitches to run diagnostic commands and attach the results to an email message when CPU or memory usage exceeds specified thresholds.
Explanation:
B. Automation stitches support sequential action execution where the output (parameters) from one action can be used as input for the next action. This is achieved using variables (like %%log.time%% or %%results%%) that capture data from a previous step, enabling complex workflows.
D. This describes a primary use case. An automation stitch can be triggered by a CLI script action (e.g., diagnose sys top) and an email action to send the results. The trigger condition can be based on system metrics like high CPU/memory, defined via a System Threshold Monitor or event-based trigger.
Why the Other Options are Incorrect:
A. Automation stitches are configured on the FortiGate Manager (FMG) or locally on a standalone FortiGate. They are not configurable on "any FortiGate device in a Security Fabric environment" unless that device is the FMG or the primary Fabric root.
C. Automation stitches configured for parallel execution run all actions simultaneously when triggered. You cannot insert a specific delay between actions in parallel mode. Delays (pause action) are only available in sequential mode to control timing between steps.
Reference:
FortiOS Automation Guide – Stitches can run actions sequentially with variable passing and are triggered by events (logs, thresholds). They integrate CLI diagnostics with notification actions like email.
Refer to the exhibit, which shows the output of get router info bgp summary.
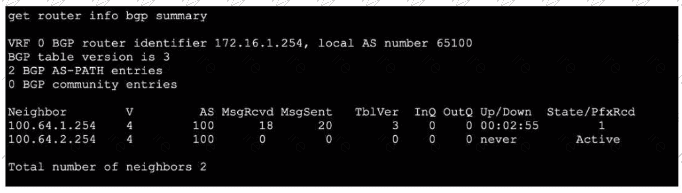
Which two statements are true? (Choose two.)
A. The local ForliGate has received one prefix from BGP neighbor 100.64.1.254.
B. The TCP connection with BGP neighbor 100.64.2.254 was successful.
C. The local FortiGate has received 18 packets from a BGP neighbor.
D. The local FortiGate is still calculating the prefixes received from BGP neighbor 100.64.2.264
Explanation:
A.The column State/PfxRcd shows the number of prefixes received from each neighbor. For neighbor 100.64.1.254, the value is 1, indicating one BGP route (prefix) has been accepted and installed in the routing table.
C. The column MsgRcvd shows the total number of BGP messages received from each neighbor since the session started. For neighbor 100.64.1.254, the value is 18 BGP packets (which include KEEPALIVE, UPDATE, NOTIFICATION, and OPEN messages).
Why the Other Options are Incorrect:
B. The TCP connection with neighbor 100.64.2.254 was NOT successful.
The State is shown as Active, which means the FortiGate is attempting to establish a TCP connection (or a BGP session) but has not succeeded. A successful session would show a numeric prefix count and an Up/Down time (like 00:02:55), not Active.
D. This is incorrect for two reasons.
First, the neighbor IP is wrong (100.64.2.264 vs. the actual 100.64.2.254 in the output). Second, the neighbor 100.64.2.254 is in Active state, meaning no BGP session exists, so there are no prefixes to calculate. The FortiGate is not calculating prefixes; it is stuck trying to establish the initial TCP connection.
Reference:
FortiOS BGP monitoring. In get router info bgp summary:
State/PfxRcd: Shows session state and prefixes received (a number means established; Active means trying to connect).
MsgRcvd: Total BGP messages received from that neighbor.
Up/Down: Session duration; never means never established.
Refer to the exhibit, which shows the partial output of a diagnose command.
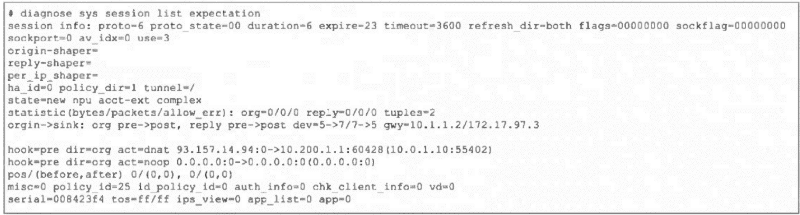 Which two conclusions can you draw from the output shown in the exhibit? (Choose two.)
A. FortiGate will drop the expected traffic if it does not arrive within 23 seconds.
B. Clearing the master session has no impact on the expectation session.
C. This is a pinhole session to allow traffic for a TCP protocol that dynamically assigns TCP ports.
D. The session is checked against firewall policy ID 25.
Explanation:
A. The expire=23 field indicates this is a session expectation (a temporary pinhole) that will be removed if the expected return traffic is not seen within 23 seconds. This is a security measure to close dynamic pinholes if the anticipated traffic doesn't arrive.
C. The state=new npu acct-ext complex and proto_state=00 with expire timer are classic indicators of a session expectation created for protocols that use dynamic ports (like FTP, SIP, or certain gaming protocols). The firewall creates this placeholder/pinhole to allow the expected return traffic, which will match this expectation and spawn a new data session.
Why the Other Options are Incorrect:
B. Clearing the master session does impact the expectation session.
Expectations are dependent on the parent session that created them (e.g., the FTP control session). If the master session is cleared (terminated), its associated expectations are also removed because the pinhole is no longer needed.
D. The session is not checked against firewall policy ID 25.
The field policy_id=25 is the policy ID of the parent/master session that triggered this expectation. The expectation session itself bypasses policy check (hook=pre dir=org act=chat shows it's handled pre-policy by the kernel). Traffic matching this expectation will be allowed without re-evaluating policy ID 25.
Reference:
FortiOS Session Helpers and Expectations. In diagnose sys session list output:
expire: Timer for expectation sessions.
state=...complex: Indicates a helper-created expectation.
hook=pre dir=org act=chat: Shows the session is processed in the kernel pre-policy for ALG/helper traffic.
| Page 3 out of 18 Pages |
| 123456789 |
| FCSS_NST_SE-7.6 Practice Test Home |
Choosing the right preparation material is critical for passing the FCSS - Network Security 7.6 Support Engineer exam. Here’s how our FCSS_NST_SE-7.6 practice test is designed to bridge the gap between knowledge and a passing score.
Copyright © - All Rights Reserved