Last Updated On : 17-Jul-2026
Total 64 Questions
Which two FortiSIEM components work together to provide real-time event correlation?
A. Supervisor and worker
B. Collector and Windows agent
C. Worker and collector
D. Supervisor and collector
Explanation:
Real-time correlation in FortiSIEM is a distributed process that involves specific components in the data pipeline. Both provided pairs are integral to this workflow.
A. Supervisor and Worker:
This is the primary pair for executing correlation logic. The Supervisor hosts the rule definitions and management interface. It dispatches these rules to one or more Worker nodes.
Workers are the engines that perform the real-time event processing, correlation, and analytics. They receive a stream of normalized events, apply the correlation rules, and create incidents when conditions are met. The Supervisor then receives and displays these incidents.
C. Worker and Collector:
This pair represents the critical data flow path for real-time correlation. Collectors are responsible for receiving raw logs from devices (via syslog, SNMP, agents, etc.), parsing them, normalizing them into a standard format, and forwarding these normalized events in real-time to the Worker nodes.
Without Collectors feeding normalized data to the Workers, the correlation engines would have nothing to process. Therefore, they "work together" to enable real-time correlation.
Why the others are incorrect:
B. Collector and Windows Agent:
While a Windows Agent is a type of data source that sends logs to a Collector, the Agent itself does not perform correlation. This pair is about log collection, not correlation processing. The correlation happens later in the pipeline (at the Worker).
D. Supervisor and Collector:
The Supervisor manages Collector configuration, but Collectors do not send event data directly to the Supervisor for real-time correlation processing in standard scaled deployments. Their primary real-time data stream is to the Workers. The Supervisor's interaction with Collectors is more for management and health monitoring.
Reference:
FortiSIEM Administration Guide, Architecture section, detailing the roles of Supervisor, Worker, and Collector in the event processing pipeline.
Refer to the exhibit.
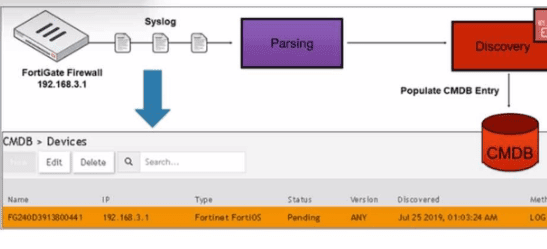
How was the FortiGate device discovered by FortiSIEM?
A. GUI log discovery
B. Syslog discovery
C. Pull events discovery
D. Auto log discovery
Explanation:
The exhibit shows two key pieces of evidence:
1.Top Label: The explicit label "Syslog" at the top of the interface panel indicates the context of this view. You are looking at the Syslog Discovery section of FortiSIEM.
2.Device in "Pending" Status:
The device (FG240D0N1S800441) is listed in the table with a Status of "Pending". This is the hallmark of Syslog Discovery.
3.How Syslog Discovery Works: When FortiSIEM receives a syslog message from an unknown source IP, it automatically creates a placeholder device entry in the CMDB with the status "Pending". This is a passive discovery method.
4.Next Step: An administrator must then "Edit" this pending entry to assign the correct device template (e.g., Fortinet FortiOS), credentials, and other attributes, after which its status changes to "Active."
Why the Other Options are Incorrect:
A. GUI log discovery / D.
Auto log discovery: These are not standard, distinct discovery methods in FortiSIEM terminology related to this context.
C. Pull events discovery:
This refers to active discovery methods where FortiSIEM initiates connections (via SNMP, WMI, SSH, etc.) to poll devices using credentials stored in the CMDB. A device discovered this way would typically show an "Active" status from the start, not "Pending." The exhibit shows no credentials configured, and the status is "Pending," which is inconsistent with pull discovery.
Reference:
FortiSIEM Administration Guide, "Discovering Devices" chapter, specifically the section on "Syslog Discovery" which describes the automatic creation of pending device entries.
Refer to the exhibit.
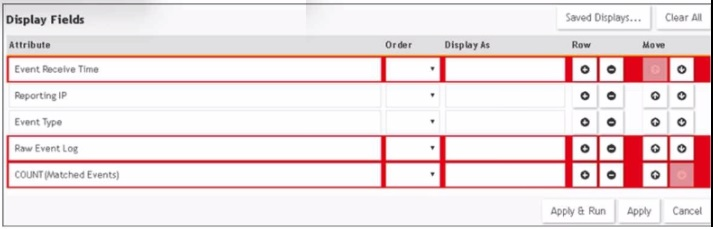
A FortiSIEM administrator wants to group some attributes for a report, but is not able to do
so successfully.
As shown in the exhibit, why are some of the fields highlighted in red?
A. Unique attributes cannot be grouped.
B. The Event Receive Time attribute is not available for logs.
C. The attribute COUNT(Matched events) is an invalid expression.
D. No RAW Event Log attribute is available for devices.
🔎 Explanation:
In FortiSIEM’s reporting and rule engine, grouping is used to aggregate events based on shared attributes. However, certain fields — especially those that are unique per event, like:
Event Receive Time
Raw Event Log
COUNT(Matched Events) (which is an aggregate, not a raw attribute)
— cannot be used in Group By operations, because they don’t represent shared values across multiple events. Attempting to group by these will result in validation errors, and FortiSIEM highlights them in red to indicate invalid grouping.
This is a common mistake when building reports or rules: trying to group by fields that are inherently non-groupable due to their uniqueness or derived nature.
❌ Why Others Are Wrong:
B. Event Receive Time not available for logs
→ False. It’s available, but not valid for grouping.
C. COUNT(Matched Events) is invalid
→ False. It’s valid as a display field or aggregate, but not for grouping.
D. No RAW Event Log for devices
→ Misleading. Raw logs exist, but again, they’re unique per event and not groupable.
📖 Reference:
FortiSIEM Admin Guide 6.3, section: Creating Reports – Group By Limitations
Fortinet KB: Why Some Fields Cannot Be Grouped in FortiSIEM Reports (community.fortinet.com)
In the rules engine, which condition instructs FortiSIEM to summarize and count the matching evaluated data?
A. Time Window
B. Aggregation
C. Group By
D. Filters
Explanation:
In the FortiSIEM correlation rules engine, these components have distinct purposes:
B. Aggregation:
This is the section that explicitly defines the summarization and counting logic. Here you set the condition that determines when the rule triggers, based on a count of matching events within a specified time frame.
Example Configuration: COUNT > 5 WITHIN 60 SECONDS. This instructs FortiSIEM to summarize (collect) and count the matching events over the 60-second window, and trigger an incident only if the count exceeds 5.
Why the others are not correct for summarization and counting:
A. Time Window:
This is part of the Aggregation condition (e.g., "WITHIN 60 SECONDS"). By itself, it only defines the duration to look back, not the action of summarizing and counting.
C. Group By:
This determines how many separate incidents are created by splitting the aggregated events into groups based on attributes (e.g., per user, per IP). It works after or in conjunction with aggregation to split the counts, but it does not perform the initial summarization and counting.
D. Filters:
This section only selects which individual events are evaluated by the rule (e.g., Event Type = "Failed Login"). It does not perform any summarization or counting.
Reference:
FortiSIEM Administrator Guide, "Creating Correlation Rules," specifically the section explaining the Aggregate condition and its role in counting events over a time window.
Refer to the exhibit.
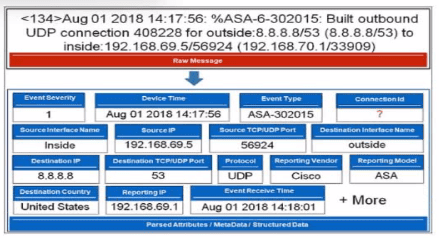
Which value will FortiSIEM use to populate the Connection Id field?
A. 33909
B. 134
C. The connection ID is not in the raw message.
D. 408228
Explanation:
1.Parse the Raw Log: The raw message begins:
<134>Aug 01 2018 14:17:56:%ASA-6-302015:Built outbound UDP connection **408228** for outside:...
The number 408228 immediately follows the phrase "UDP connection" and precedes the keyword "for". This is the unique connection identifier assigned by the ASA firewall for this specific session.
2.FortiSIEM Parsing Logic:
FortiSIEM uses device-specific parsers (Phantom Models). For the Cisco ASA ASA-302015 event ("Built outbound UDP connection"), the parser is designed to extract this numeric identifier after "connection" as the Connection ID field.
Why the Other Options are Incorrect:
A. 33909:
This is the NAT-translated source port (192.168.70.1/33909) shown in parentheses. It is not the connection ID.
B. 134:
This is the syslog priority/facility value (<134>), which indicates the message's severity and origin within the ASA. It is unrelated to the connection.
C. The connection ID is not in the raw message:
This is false. As shown, the connection ID 408228 is clearly present in the raw log.
Reference:
This aligns with the understanding of Cisco ASA log formats and FortiSIEM's parsing capabilities for common network devices, as covered in the FortiSIEM Analyst and Administration curriculum. The Connection ID is a standard extracted field for firewall connection logs.
In which state can a device be moved into the CMDB to prevent monitoring log collection?
A. Unmanaged
B. Unapproved
C. Pending
D. Void
Explanation:
In FortiSIEM's CMDB, the device state controls what actions the system performs on the device. The state specifically used to halt all active monitoring and log collection is:
A. Unmanaged:
When a device is placed in the "Unmanaged" state, FortiSIEM stops all active monitoring activities for that device. This includes:
Stopping the collection of logs (syslog, SNMP traps, agent logs).
Halting active polling (SNMP, WMI, CLI) for performance and configuration data.
The device remains in the CMDB for reference, but it is effectively taken out of the operational monitoring loop.
Why the other states are incorrect:
B. Unapproved:
This is not a standard CMDB device state in FortiSIEM.
C. Pending:
This is an intermediate state used during Syslog Discovery. A device in "Pending" status is not yet actively monitored because it lacks a proper device template and credentials. However, this state is not used to intentionally stop monitoring an existing managed device; it's a temporary, automated state for undiscovered devices. An administrator would not move a device to "Pending" to disable it.
D. Void:
This is not a standard CMDB device state in FortiSIEM for controlling monitoring.
Reference:
FortiSIEM Administration Guide, "Managing the CMDB" section, which details device states (Active, Inactive, Unmanaged) and their effects on monitoring and collection.
Which is a requirement for implementing FortiSIEM disaster recovery?
A. All worker nodes must access both supervisor nodes using IP.
B. SNMP, and WMI ports must be open between the two supervisor nodes.
C. The two supervisor nodes must have layer 2 connectivity.
D. DNS names must be used for the worker upload addresses.
Explanation:
In FortiSIEM Disaster Recovery (DR) deployments, DNS-based addressing is mandatory for proper failover between primary and secondary supervisors. Workers, collectors, and agents must use DNS names (not static IPs) when uploading events so that DNS redirection can seamlessly reroute traffic to the active supervisor during a disaster.
This requirement ensures:
Failover flexibility: DNS can be updated to point to the secondary supervisor.
Operational continuity: No need to reconfigure agents or collectors manually.
📖 Reference:
Fortinet Documentation:
Disaster Recovery Procedures
❌ Why Others Are Wrong:
A. IP-based access for workers
→ Invalid. IPs break DR failover; DNS is required.
B. SNMP/WMI ports between supervisors
→ Not required. These are used for device polling, not supervisor-to-supervisor communication.
C. Layer 2 connectivity
→ Not mandatory. Supervisors can operate across Layer 3 networks as long as DNS and shared storage are properly configured.
| Page 3 out of 10 Pages |
| 12345 |
| NSE5_FSM-6.3 Practice Test Home |
Choosing the right preparation material is critical for passing the Fortinet NSE 5 FortiSIEM 6.3 exam. Here’s how our NSE5_FSM-6.3 practice test is designed to bridge the gap between knowledge and a passing score.
Copyright © - All Rights Reserved