Last Updated On : 17-Jul-2026
Total 66 Questions
Which statement correctly describes one Difference between templates and reports?
A. Reports provide mora configuration options than templates
B. Templates can becloned, but reports cannot be cloned.
C. Reports support macros, but templates do not.
D. Template are mapped to device groups. while reports are mapped to ADOMs
Explanation:
This question tests your understanding of the functional differences between templates and reports in FortiAnalyzer. While both are used in the reporting process, they serve different purposes and have different scopes within the ADOM structure.
✅Correct Option:
D. Templates are mapped to device groups, while reports are mapped to ADOMs.
When configuring a report in FortiAnalyzer, reports exist within an ADOM context and each ADOM has its own report settings . During report configuration, you select which devices to include from the "Devices" section . Templates, however, define the structure and layout and are populated with data when the report is generated against specific device groups . Therefore, templates provide the reusable structure that is applied to device groups when generating reports within an ADOM .
❌Incorrect options:
A. Reports provide more configuration options than templates.
Both reports and templates have substantial configuration options for their respective purposes. Templates contain the layout, charts, and macros , while reports add generation-specific settings like time period and device selection . Neither inherently provides "more" options.
B. Templates can be cloned, but reports cannot be cloned.
Both templates and reports can be cloned. The FortiAnalyzer Administration Guide explicitly states that right-clicking on a report template provides the option to "Clone" the selected report .
C. Reports support macros, but templates do not.
Macros are included in templates, not reports. Templates specify what macros to use in the report layout . Macros are part of the template definition and are populated with data when the report is generated .
Reference:
🔧 FortiAnalyzer 7.6.3 Administration Guide - Predefined reports, templates, charts, and macros
→ Defines templates as containing charts and/or macros and specifying the layout of the report, while reports can be generated directly from templates.
🔧 FortiAnalyzer 7.6.4 Administration Guide - How reports are populated
→ Explains that each ADOM has its own reports, datasets, charts, and macros, and that reports rely on charts and macros configured in templates.
Exhibit.

What is the purpose of using the Chart Builder feature On FortiAnalyzer?
A. To build a chart automatically based on the top 100 log entries
B. To add charts directly to generatereports in the current ADOM.
C. To add a new chart under FortiView to be used in new reports
D. To build a dataset and chart based on the filtered search results
Explanation:
This question tests knowledge of the Chart Builder feature available within the Log View section of FortiAnalyzer. It assesses understanding of what Chart Builder is designed to do, how it is accessed, and how its output integrates with the broader reporting workflow.
✔️ D. To build a dataset and chart based on the filtered search results.
Chart Builder allows you to create custom charts based on the view and filters in Log View. After the chart is created, it is saved to the Chart Library where you can apply it to a report. Fortinet This means the analyst first applies filters to narrow down specific log data in Log View, then uses Chart Builder to generate a dataset and corresponding chart from those filtered results. The chart is then stored in the Chart Library for use in future reports, making this a powerful on-demand chart creation workflow.
❌ A. To build a chart automatically based on the top 100 log entries.
Chart Builder does not work on a predefined or automatic selection of the top 100 log entries. To use Chart Builder, an analyst must first go to Log View, select a log view, and apply filters as required before accessing Chart Builder from the toolbar. Fortinet The chart generation is driven by the analyst's manually applied filters and log selection — not by any automatic top-N entry logic.
❌ B. To add charts directly to generated reports in the current ADOM.
Chart Builder does not add charts directly into an already-generated report. Once a chart has been created using Chart Builder, it can be inserted into a new report via the Reports Editor tab. Fortinet The chart is first saved to the Chart Library, and it is then manually added to a report during the report design phase — it is not injected directly into existing or generated reports.
❌ C. To add a new chart under FortiView to be used in new reports.
Chart Builder is not a FortiView feature — it is a tool within Log View. Log View includes a Chart Builder for you to build custom charts for each type of log message, accessible by going to Log View, selecting a device type and log type, and clicking More > Chart Builder. Fortinet Charts created by Chart Builder are saved to the Chart Library under Reports, not added as FortiView widgets or dashboards.
🔧 Reference:
⇒ Creating Charts with Chart Builder – FortiAnalyzer 7.6.0 Administration Guide
→ Confirms that Chart Builder is accessed from Log View, builds charts based on filtered log data, and saves them to the Chart Library for use in new reports.
Refer to Exhibit: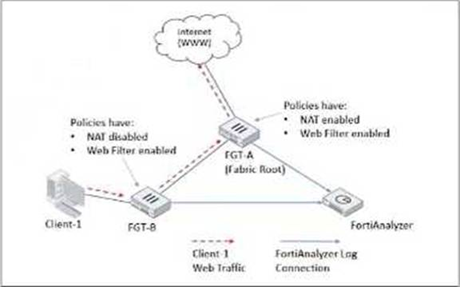
Client-1 is trying to access the internet for web browsing.
All FortiGate devices in the topology are part of a Security Fabric with logging to FortiAnalyzer configured.
All firewall policies have logging enabled. All web filter profiles are configured to log only violations.
Which statement about the logging behavior for this specific traffic flow is true?
A. Only FGT-B will create traffic logs.
B. FGT-B will see the MAC address of FGT-A as the destination and notifies FGT-A to log this flow.
C. FGT B will create traffic logs and will create web filter logs if it detects a violation.
D. Only FGT-A will create web filter logs if it detects a violation.
Explanation:
❌ A. Only FGT-B will create traffic logs.
Traffic logging (forward traffic logs) normally happens at each FortiGate that processes the session—especially since all policies have logging enabled. FGT-B would log the session as it enters and exits, and FGT-A would also generate its own traffic log after NAT. This option ignores FGT-A's role entirely. A common mix-up is thinking only the first device logs traffic, but in Fabric setups both typically do (though FortiAnalyzer correlates them smartly).
❌ B. FGT-B will see the MAC address of FGT-A as the destination and notifies FGT-A to log this flow.
This sounds like a creative guess, but FortiGates don't "notify" each other to create logs in that way for standard traffic flows. In the Security Fabric, devices share topology awareness (including MACs of directly connected peers), but logging responsibility isn't delegated like this. Traffic logs are generated locally by each device that handles the packets. No such notification mechanism exists for basic web traffic logging.
❌ C. FGT B will create traffic logs and will create web filter logs if it detects a violation.
FGT-B does create traffic logs (agreed—policies have logging enabled). But would FGT-B generate the web filter violation log? Here's the key reflection: since FGT-A (the root) is performing NAT, and web filtering typically needs to see the real destination URL/category before NAT obscures things, in standard Security Fabric outbound flows with downstream → root NAT, the deep content inspection (including web filter category blocking/violation) usually happens at the egress/root FortiGate that owns the public IP and performs NAT. FGT-B is more likely just routing/forwarding without applying the final web filter decision/logging. This is a subtle but frequent point of confusion in Fabric scenarios.
✅ D. Only FGT-A will create web filter logs if it detects a violation.
This aligns most closely with typical behavior in this exact topology. Because FGT-A is the NAT boundary and the final policy enforcement point before Internet egress, it performs the web filter inspection on the actual requested URL/category. If a violation occurs (e.g., blocked category), only FGT-A generates the web filter log (since profiles log violations only). FGT-B may apply its own policy and log traffic, but the violation-specific UTM log comes from the device that made the blocking decision—here, the root with NAT. FortiAnalyzer then correlates everything nicely across the Fabric.
Reference:
https://docs.fortinet.com/product/fortianalyzer
Refer to the exhibit.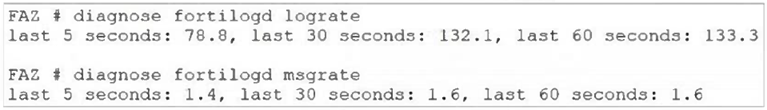
What can you conclude about the output?
A. The low indexing values require investigation.
B. The output is not ADOM specific.
C. There are more event logs thantraffic logs.
D. The log rate higher than the message rate is not normal.
Explanation:
This question checks whether you understand the relationship between log rate and message rate in FortiAnalyzer diagnostics. These two values are closely related and normally track each other. When they don’t, it can indicate a problem in the logging pipeline. The exhibit shows a clear imbalance, and the question asks what conclusion you can reasonably draw from that.
✅ Correct Answer: D. The log rate higher than the message rate is not normal
In a healthy FortiAnalyzer system, the message rate should be equal to or higher than the log rate, because:
🔹 Messages are processed internally by fortilogd
🔹 Logs are the resulting records written after processing
If the log rate is significantly higher than the message rate, as shown in the output, this is abnormal. It suggests that logs are being generated or counted faster than messages are being processed, which can point to processing inconsistencies, backlog issues, or abnormal behavior in the logging subsystem.
This mismatch is exactly what the diagnostic output is highlighting, and it warrants attention.
❌ Incorrect Options
A. The low indexing values require investigation.
Indexing is not shown in this output at all. The commands used (diagnose fortilogd lograte and diagnose fortilogd msgrate) report rates, not indexing performance. Drawing conclusions about indexing here is unsupported.
B. The output is not ADOM specific.
While it’s true that these commands are global diagnostics, that is not the key takeaway from the exhibit. The question asks what you can conclude about the output itself, not the scope of the command. This option is technically irrelevant to the observed issue.
C. There are more event logs than traffic logs.
Nothing in the output differentiates event logs vs traffic logs. The diagnostics only show aggregate message and log rates. Choosing this option means inventing data that is simply not present.
Reference:
Fortinet Documentation
Which statement about SQL SELECT queries is true?
A. They can be used to purge log entries from the database.
B. They must be followed immediately by a WHEREclause.
C. They can be used to display the database schema.
D. They are not used in macros.
Explanation:
✅ D. They are not used in macros.
This is the correct answer. Within FortiAnalyzer, macros are small, reusable pieces of pre-defined SQL logic, but they themselves are not full SELECT queries. Instead, macros are defined using the SELECT statement and then saved as a named object (like $src_ip). They are used within SELECT queries in reports or charts to simplify complex logic. You would insert a macro ($src_ip) into the SELECT clause of your main query. So, the complete SELECT query is the container, and the macro is a component inside it.
Think of it this way: You use a SELECT query to build and employ a macro, but the final saved macro isn't itself a standalone SELECT query you run. This is a subtle but important distinction in the FortiAnalyzer architecture.
❌ A. They can be used to purge log entries from the database.
This is incorrect. The SELECT statement is a Data Query Language (DQL) command. Its only function is to read or retrieve data from the database. It cannot modify or delete data. To purge or delete log entries, you would use a Data Manipulation Language (DML) command like DELETE. FortiAnalyzer intentionally restricts this capability to protect data integrity; log purging is typically done through administrative functions (like Archive & Purge) or automatic retention policies, not via direct SQL DELETE commands.
❌ B. They must be followed immediately by a WHERE clause.
This is incorrect. A WHERE clause is optional in a SELECT query. It is used to filter results. A basic, valid SELECT query could simply be:
SELECT datetime, srcip, action FROM $log
This would return all records from the log view. While WHERE is extremely common for filtering, it is not a syntactic requirement.
❌ C. They can be used to display the database schema.
This is a tricky one but incorrect in the FortiAnalyzer context. In standard SQL, you can use specialized SELECT queries on system tables (like information_schema) to discover the schema. However, FortiAnalyzer does not expose its underlying database schema in this way to users. The log database structure is abstracted through predefined log views (like $log, $traffic). Analysts write SELECT queries against these views, not against the raw database tables. Therefore, you cannot use a SELECT query in FortiAnalyzer's report editor to explore or display the internal schema.
Reference:
Official Fortinet Documentation
You mustfind a specific security event log in the FortiAnalyzer logs displayed in FortiView, but, so far, you
have been uncuccessful.
Which two tasks should you perform to investigate why you are having this issue? (Choose two.)
A. Open .gz log files in FortiView.
B. Rebuild the SQL database and check FortiView.
C. Review the ADOM data policy
D. Check logs in the Log Browse
Explanation:
When you can't find a log in FortiView, it’s usually because of how FortiAnalyzer handles data. FortiAnalyzer stores logs in two main "states": Archive (raw logs saved as compressed .gz files) and Analytics (logs indexed in an SQL database for fast searching and dashboarding).
FortiView relies entirely on the SQL database (Analytics). If the database is out of sync or if the logs haven't been indexed yet, they won't show up in FortiView, even if the FortiAnalyzer actually received them.
The Breakdown
✅ Option B: Rebuild the SQL database and check FortiView.
This is a primary troubleshooting step. If logs exist on the disk but aren't appearing in FortiView, it often means the SQL index is corrupt or incomplete. Rebuilding the database (using execute sql-local rebuild-db) forces FortiAnalyzer to re-scan the raw archive files and re-insert them into the SQL database, making them visible to FortiView again.
✅ Option D: Check logs in the Log Browse.
Log Browse is the best place to verify if the "raw" data actually exists. Unlike FortiView, Log Browse shows the actual files stored on the disk (the Archive logs). If you can see the logs here but not in FortiView, you know the issue is with the SQL indexing (Analytics). If the logs aren't even in Log Browse, then the FortiAnalyzer never received them in the first place.
❌ Option A: Open .gz log files in FortiView.
This is a technical impossibility. FortiView is a graphical dashboard that queries a database; it cannot "open" or read compressed .gz files directly. You would use Log Browse to download or view these raw files, but not FortiView.
❌ Option C: Review the ADOM data policy.
While the data policy controls how long logs are kept (retention), changing it won't help you find a missing log that should be there currently. The policy determines when logs are deleted or moved from Analytics to Archive, but it isn't a tool for investigating why a specific existing log isn't appearing in a dashboard.
Teacher's Tip for the Exam
A common "trap" in FortiAnalyzer questions is confusing Log View (which uses the SQL database) with Log Browse (which uses the raw file system). Always remember:
🔹 FortiView/Reports/Log View = SQL Database (Analytics).
🔹 Log Browse = Raw Files (Archive).
Reference:
Fortinet Document Library
Which log will generate an event with the status Unhandled?
A. An AV log with action=quarantine.
B. An IPS log with action=pass.
C. A WebFilter log willaction=dropped.
D. An AppControl log with action=blocked.
Explanation:
In FortiAnalyzer (and FortiOS), the “Unhandled” status in event logs typically indicates that a security event was detected but no blocking or mitigating action was taken—meaning traffic was allowed to pass. This is often used for monitoring or alerting purposes only, not enforcement. So, if a security feature detects a threat but is configured to “pass” (i.e., allow) the traffic, FortiAnalyzer may classify that event as Unhandled, because the system did not actively handle (block, quarantine, etc.) the threat.
Correct Answer
✅ B. An IPS log with action=pass.
When an Intrusion Prevention System (IPS) signature matches traffic but is set to action=pass, FortiGate logs the event but allows the traffic to continue. Since no protective action was taken—no block, reset, or drop—the event is considered “Unhandled” in FortiAnalyzer’s event view. This is by design: “Unhandled” reflects detection without intervention, which is exactly what action=pass means in IPS policies.
Incorrect Answers
❌ A. An AV log with action=quarantine.
If antivirus (AV) scanning results in quarantine, the malicious file has been actively handled—isolated from the system. This is a clear enforcement action, so the event status will be “Handled”, not “Unhandled.” Quarantine is a definitive response, not passive observation.
❌ C. A WebFilter log with action=dropped.
When Web Filtering drops a request (e.g., due to a category block), the connection is terminated. This is an active enforcement action. FortiAnalyzer marks such events as “Handled” because the threat or policy violation was addressed by blocking access.
💡 Note:
The option says “willaction=dropped”—likely a typo for “with action=dropped.” Regardless, the intent is clear.
❌ D. An AppControl log with action=blocked.
Application Control logs with action=blocked mean the application was explicitly denied. Like WebFilter and AV quarantine, this is an active control measure. Therefore, the event is Handled, not Unhandled.
Why This Matters?
Understanding the distinction between detection-only (pass) and enforcement (block, quarantine, drop) is crucial for interpreting FortiAnalyzer reports, especially when auditing security posture or investigating why certain threats weren’t stopped.
Reference:
https://docs.fortinet.com/product/fortianalyzer/7.6
| Page 2 out of 10 Pages |
| 12345 |
| FCP_FAZ_AN-7.6 Practice Test Home |
Choosing the right preparation material is critical for passing the Fortinet NSE 5 FortiAnalyzer 7.6 Analyst exam. Here’s how our FCP_FAZ_AN-7.6 practice test is designed to bridge the gap between knowledge and a passing score.
Copyright © - All Rights Reserved