Last Updated On : 17-Jul-2026
Total 66 Questions
The smartest way to prepare for your Fortinet FCP_FAZ_AN-7.6 2026 exam isn't just reading — it's practicing. Our Fortinet NSE 5 FortiAnalyzer 7.6 Analyst practice test bridge gap, transforming your knowledge into a passing score. Familiarize yourself with the exact style and difficulty of the real Fortinet FCP_FAZ_AN-7.6 practice questions, so there are no surprises. Get detailed feedback to identify your strengths and target your weaknesses, making your study time more efficient.
An administrator on your team has configured multiple reports to run periodically. Management has an
additional request that all new generated reports be sent to a company email inbox for accessibility. The mail
server has already been configured on FortiAnalyzer.
Which item must configure on FortiAnalyzer so that emails are sent when the reports are generated?
A. Enable the option to email all repots under the mail server.
B. Add amailto:
C. Enable email notification under the report calendar.
D. Enable an output profile on the reports.
Explanation:
This question tests knowledge of how FortiAnalyzer distributes scheduled reports. Even if the mail server is already configured, FortiAnalyzer will not automatically email generated reports. An output profile must be attached to the report to define the delivery method such as email.
🟢 Correct Option: D. Enable an output profile on the reports
Output profiles define how generated reports are delivered. Administrators can configure email recipients in the output profile so that whenever the scheduled report runs, FortiAnalyzer automatically sends the generated report to those recipients using the configured mail server.
🔴 Incorrect Option: A. Enable the option to email all reports under the mail server
The mail server configuration only provides SMTP settings used for sending emails. It does not determine which reports are emailed. Report distribution must be defined in the report configuration using an output profile.
🔴 Incorrect Option: B. Add a mailto: option within the report layouts
Report layouts control how report data is presented, including charts, tables, and formatting. They do not control the delivery method of the report and cannot trigger emails when a report is generated.
🔴 Incorrect Option: C. Enable email notification under the report calendar
The report calendar is used to schedule when reports are generated. It does not define the delivery mechanism. Email delivery requires configuring an output profile rather than modifying the report schedule.
🔧 Reference:
→ Output profiles – FortiAnalyzer 7.6 Administration Guide
Confirms that output profiles allow administrators to define email addresses to which generated reports are sent.
→ Creating output profiles – FortiAnalyzer 7.6 Administration Guide
Shows that administrators can enable “Email Generated Reports” and specify recipients when configuring an output profile.
(Refer to the exhibit.)
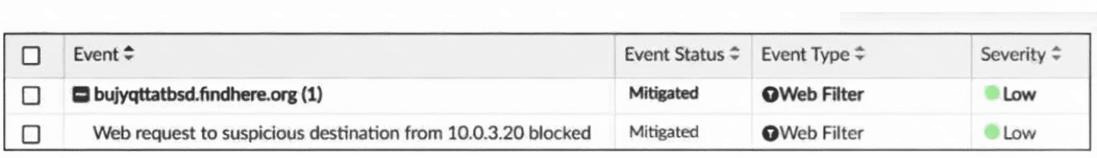
Which statement about the displayed event is correct? (Choose one answer))
A. The security risk was dropped.
B. The risk source is isolated.
C. The security risk was blocked.
D. The security event risk is from an application control log.
Explanation:
FortiAnalyzer captures and displays security events from FortiGate logs, categorizing them by risk levels like low, medium, or high based on predefined event handlers. These events highlight potential threats, such as blocked web requests to suspicious sites, helping admins quickly spot and respond to risks without digging through raw logs.
Correct Answer
✅ C. The security risk was blocked.
This nails it because the event description explicitly reads "Web request to suspicious destination 10.0.3.20 blocked," confirming the action taken by the FortiGate's web filter policy. The "Medium" severity aligns with a proactive block on a risky URL, and the event status shows it's actively monitored in FortiAnalyzer-exactly how these systems log enforced security actions to prevent threats from succeeding.
Why Others Are Wrong
❌ A. The security risk was dropped.
Not quite—dropping typically refers to packet-level discards (like in DoS policies), but here the log specifies "blocked," which is the web filter's term for denying the full HTTP request after inspection. A common mix-up is confusing drop (silent discard) with block (explicit denial, often with a replacement page).
❌ B. The risk source is isolated.
Nope, there's zero mention of isolation, which FortiAnalyzer would flag via a separate event type (like from endpoint quarantine or FortiClient integration). Isolation actions show explicit status changes for devices/users; this is purely a web access block, no quarantine involved.
❌ D. The security event risk is from an application control log.
Off target—this event type is clearly "Web Filter" (right in the exhibit), not application control, which handles app signatures like P2P or social media. Folks sometimes blur these since both are security profiles, but the labels and descriptions keep them distinct in logs.
Reference:
https://docs.fortinet.com/product/fortianalyzer/7.6
Exhibit.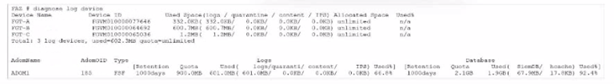
What can you conclude from this output?
A. There is not disk quota allocated to quarantining files.
B. FGT_B is the Security Fabric root.
C. The allocated disk quote to ADOM1 is 3 GB.
D. Archive logs are using more space than analytic logs.
Explanation:
The output shows two logging devices:
✔️ One listed simply as FGT-A with a normal serial number (FGT...7744).
✔️ The other listed as FSMSH followed immediately by the serial number for FGT-B (FSMSH...0462).
That FSMSH prefix isn't something we see on every device. What might a special prefix like that tell us in the context of FortiAnalyzer when it's collecting logs from a Security Fabric environment?
Think about how FortiAnalyzer identifies and displays devices that participate in the Security Fabric. In a Fabric setup, one FortiGate holds a unique leadership role. Does FortiAnalyzer use any distinctive marker in diagnostic outputs (like diagnose log device) to show which device is that central point?
Now, let's walk through each choice carefully, asking ourselves what the evidence directly supports:
A. There is not disk quota allocated to quarantining files. ❌
Look closely at the columns—especially around "quarantine / content / IPS". We see values like 0.00GB / 0.00GB (0.00%) or very small numbers. But zero used space doesn't automatically mean zero allocated quota. The output might show a quota limit if one were set (or "unlimited" explicitly). Here it appears more like the quota exists but hasn't been consumed yet. A common misconception is assuming "nothing used = nothing allowed"—but FortiAnalyzer can have quotas defined without immediate usage.
B. FGT_B is the Security Fabric root. ✅
The standout clue is that only FGT-B has the FSMSH prefix before its serial number. In FortiAnalyzer's log-device views (especially in Fabric-integrated setups), this prefix is a known indicator that the device is the Security Fabric root FortiGate—the central hub managing the topology. Regular member FortiGates (like FGT-A) appear without it. This is one of those subtle but reliable tells in real-world and exam scenarios. Does seeing that prefix on FGT-B feel like solid evidence of its special role?
C. The allocated disk quota to ADOM1 is 3 GB. ❌
Scan the bottom section for any ADOM-related line. We see totals and per-device quotas, but nothing explicitly states "ADOM1" with exactly 3 GB (or 3072 MB) allocated. The numbers shown (e.g., various MB/GB values, "unlimited" in places) don't match 3 GB precisely for an ADOM. A frequent mix-up here is confusing per-device quotas or total used space with an ADOM-level allocation—always check for the exact wording and value.
D. Archive logs are using more space than analytic logs. ❌
Compare the Used values under the archive-related columns versus the analytic/logs columns for each device. In most entries, analytic logs appear to consume noticeably more space (look at percentages and GB figures). Archive usage is often lower or comparable at best—not consistently higher. People sometimes reverse these categories because "archive" sounds long-term and bigger, but in practice, analytic (indexed for fast searching/reporting) usually takes the lion's share early on.
Reference:
https://docs.fortinet.com/product/fortianalyzer
Which statement about exporting items in Report Definitions is true?
A. Templates can be exported.
B. Template exports contain associated charts and datasets.
C. Chart exports contain associated datasets.
D. Datasets can be exported.
Explanation:
This question tests your understanding of export behavior in FortiAnalyzer report definitions, specifically how templates, charts, and datasets relate to each other during export. The key idea is that exports are limited and hierarchical. Some objects can be exported, and some cannot. When an object is exportable, it may or may not include its dependent components. Knowing exactly what gets bundled is critical for managing reports across FortiAnalyzer systems.
✅ Correct Answer: C. Chart exports contain associated datasets
Charts are exportable objects in FortiAnalyzer, and when you export a chart, its associated dataset is automatically included. This is intentional because a chart cannot function without the dataset that defines the underlying query. FortiAnalyzer preserves that dependency during export so the chart remains usable when imported elsewhere.
This is the only export scenario in Report Definitions where dependencies are bundled.
❌ Incorrect Options
A. Templates can be exported.
Templates cannot be exported from Report Definitions. This is a common assumption because templates look like high-level, reusable objects. In reality, templates are tightly bound to the local FortiAnalyzer environment and must be recreated manually on another system.
➡️ Common misconception: People assume templates behave like charts because they reference other objects. They do not.
B. Template exports contain associated charts and datasets.
This option is doubly wrong:
🔹 Templates cannot be exported at all.
🔹 Even if they could, FortiAnalyzer does not support exporting a full dependency tree (template → charts → datasets).
This choice is designed to catch anyone assuming FortiAnalyzer supports “full report portability.” It does not.
D. Datasets can be exported.
Datasets cannot be exported on their own. They are internal components meant to be reused locally. The only time a dataset leaves the system is when it is implicitly included in a chart export, as described in option C.
➡️ Trap to avoid: Thinking of datasets as standalone, reusable objects across systems. They are not.
Reference
Fortinet Documentation
Which statement describes archive logs on FortiAnalyzer?
A. Logs that are indexed and stored in the SQL database
B. Logs a FortiAnalyzer administrator can access in FortiView
C. Logs compressed and saved in files with the .gz extension
D. Logs previously collected from devices that are offline
Explanation:
Archive logs are FortiAnalyzer's way of storing historical log data for long-term retention. Think of them as compressed backup files that free up database resources while keeping your data accessible for compliance, forensics, or historical analysis.
✅ C. Logs compressed and saved in files with the .gz extension
This is correct. When FortiAnalyzer archives logs, it compresses them into .gz (gzip) files and stores them on disk. This compression drastically reduces storage space while preserving the data. Archive logs are moved out of the active SQL database but remain retrievable when you need them for searches, reports, or investigations.
The archiving process is automatic based on your configured retention policies. Once logs age out of the SQL database, they get compressed and archived. You can still search these archived logs, but queries take longer since FortiAnalyzer has to decompress and parse the files instead of hitting the indexed database.
❌ A. Logs that are indexed and stored in the SQL database
Wrong. This describes active logs, not archive logs. Active logs live in the SQL database where they're indexed for fast searching and real-time analysis. Archive logs have already left the SQL database—they've been compressed and moved to file storage. That's the whole point of archiving: to clear out the database while keeping historical data available.
❌ B. Logs a FortiAnalyzer administrator can access in FortiView
Wrong. FortiView works with active logs in the SQL database, not archived logs. FortiView needs indexed, queryable data for its real-time dashboards and visualizations. While you can search archived logs through other interfaces, FortiView specifically pulls from the active database for performance reasons. Once logs are archived, they're outside FortiView's scope.
❌ D. Logs previously collected from devices that are offline
Wrong. Archive logs have nothing to do with device online/offline status. This is a common misconception. Archiving happens based on time and retention policies, not device connectivity. Whether a FortiGate is online, offline, deleted, or replaced, its logs get archived according to the same age-based rules. Device status doesn't trigger or prevent archiving.
Reference:
https://docs.fortinet.com
An analyst is using FortiAI on FortiAnalyzer to simplify certain tasks but is worried about exceeding the monthly token limit. Which query will take the fewest FortiAI tokens? (Choose one answer)
A. Show logs for 192.168.1.10 (past week)
B. Show all logs from the past week
C. Can you show me all the log entries for the endpoint 192.168.1.10?
D. Show logs for 192.168.1.10
Explanation:
When using FortiAI in FortiAnalyzer 7.6, think of tokens like fuel for your AI assistant. Every word you type (the input) and every word the AI sends back (the output) consumes a portion of your monthly "fuel tank." To be efficient, you want to use the smallest possible amount of text that still provides enough context for the AI to understand exactly what you need.
In the world of Generative AI, concise and filtered prompts are the gold standard for saving tokens.
The Breakdown
✅ Option A: Show logs for 192.168.1.10 (past week) This is the most efficient query. It is concise (minimal "filler" words) and specific (includes both an IP address and a time range filter). By specifying "(past week)," you tell the AI exactly which logs to look for, which reduces the amount of processing (input tokens) and prevents the AI from trying to summarize a massive, unfiltered dataset (output tokens).
❌ Option B: Show all logs from the past week While this is relatively short, it is too broad. Asking for "all logs" can trigger a massive output response from the AI as it attempts to process every single log entry from every device for the entire week. Even if the input tokens are low, the output tokens would likely be very high, quickly draining your monthly limit.
❌ Option C: Can you show me all the log entries for the endpoint 192.168.1.10? This is a "conversational" prompt. While polite, phrases like "Can you show me all the..." are considered filler text. In a token-based system, you are paying for every "the," "can," and "you." Additionally, because it doesn't specify a time range, the AI might scan the entire database, leading to a much larger output than needed.
❌ Option D: Show logs for 192.168.1.10 This prompt is concise, but it lacks a time filter. Without a filter like "(past week)" or "(today)," the AI doesn't know the scope of the search. This often results in the AI either asking for clarification (using more tokens for a second turn) or returning a much larger historical data set than you actually wanted.
Teacher's Tip for the Exam
To save tokens on the FCP_FAZ_AN-7.6 exam and in real-world practice, follow the "Filter First" rule:
🔹 Be Concise: Use direct commands instead of questions.
🔹 Be Specific: Always include a time range or a specific device/IP.
🔹 Use Keywords: Words like "Show logs" or "Generate report" map directly to FortiAnalyzer functions, making it easier for the AI to work efficiently.
Reference
Fortinet Document Library
Exhibit.
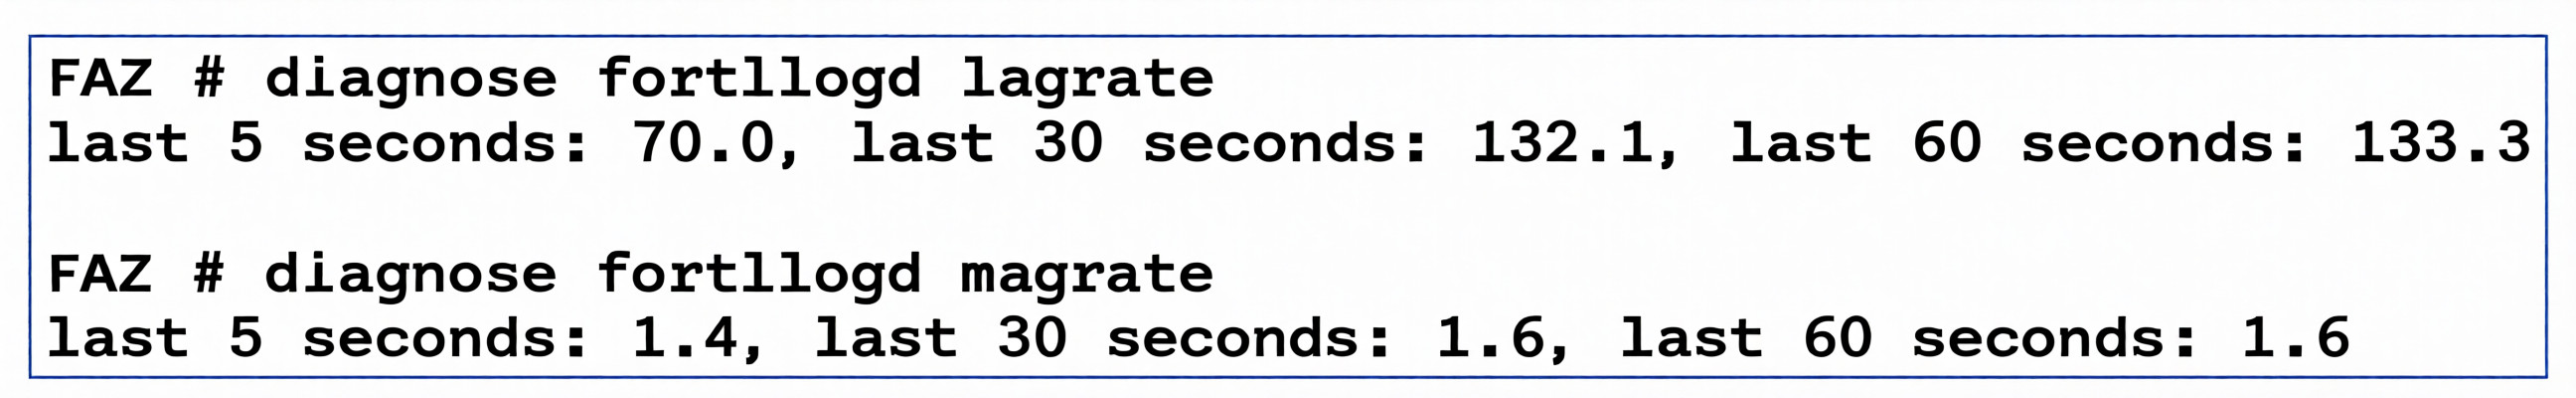
What can you conclude about the output?
A. The message ratebeing lower that the log rate is normal.
B. Both messages and logs are almost finished indexing.
C. There are more traffic logs than event logs.
D. The output is ADOM specific
Explanation:
This question tests your understanding of FortiAnalyzer diagnostics commands and log processing concepts. The exhibit shows output from two diagnostic commands: diagnose fortilogd lograte (log arrival rate) and diagnose fortilogd msgrate (message indexing rate). Understanding the relationship between these two rates is key to interpreting FortiAnalyzer performance.
✅Correct Option:
A. The message rate being lower than the log rate is normal.
In FortiAnalyzer, the log arrival rate (lograte) represents logs received by the system, while the message rate (msgrate) represents logs processed and indexed. According to Fortinet documentation, one message might contain multiple logs , so the message rate is typically lower than the log rate during normal operations, especially during peak log ingestion periods.
❌Incorrect options:
B. Both messages and logs are almost finished indexing.
There is no indication in the output that indexing is nearly complete. The command outputs show current rates only, not progress or completion status. Indexing completion cannot be determined from rate information alone.
C. There are more traffic logs than event logs.
The diagnostic commands do not differentiate between log types. Both lograte and msgrate measure all log types collectively. No information about log type distribution is provided in this output.
D. The output is ADOM specific.
These diagnostic commands show system-wide log statistics, not ADOM-specific data. ADOM-specific diagnostics would require additional parameters like diagnose fortilogd lograte-adom . The output displays global FortiAnalyzer log processing rates.
Reference:
🔧 FortiAnalyzer 7.4.1 CLI Reference - fortilogd
→ Official CLI Reference guide showing that diagnose fortilogd lograte displays the log rate and diagnose fortilogd msgrate displays the log message rate, confirming these are standard diagnostic commands.
🔧 FortiAnalyzer 6.2.0 Cookbook - Report performance troubleshooting commands
→ Cookbook guide confirming that diagnose fortilogd msgrate shows message receive rate, noting that "one message might contain multiple logs," which explains why the message rate is typically lower than the log rate.
| Page 1 out of 10 Pages |
| 12345 |
Choosing the right preparation material is critical for passing the Fortinet NSE 5 FortiAnalyzer 7.6 Analyst exam. Here’s how our FCP_FAZ_AN-7.6 practice test is designed to bridge the gap between knowledge and a passing score.
Copyright © - All Rights Reserved