Last Updated On : 17-Jul-2026
Total 66 Questions
When managing incidents on FortiAnlyzer, what must an analyst be aware of?
A. You can manually attach generated reports to incidents.
B. The status of the incident is always linked to the status of the attach event.
C. Severity incidents rated with the level High have an initial service-level agreement (SLA) response time of 1 hour.
D. Incidents must be acknowledged before they can be analyzed.
Explanation:
Incident management in FortiAnalyzer helps you track, investigate, and respond to security events systematically. The key is understanding how incidents work as independent entities that you can customize and manage separately from the underlying events that triggered them.
✅ A. You can manually attach generated reports to incidents.
Correct. FortiAnalyzer gives you the flexibility to manually attach reports to incidents. This is important for building a complete incident record—you might want to attach forensic reports, analysis summaries, or compliance documentation to provide context and evidence.
Reports don't automatically attach to incidents just because they cover related data. You need to explicitly attach them, which gives analysts control over what supporting documentation gets associated with each incident. This manual process ensures incidents contain all relevant information for investigation, remediation, and audit trails.
❌ B. The status of the incident is always linked to the status of the attached event.
Wrong. Incidents and events operate independently. An incident's status (New, Acknowledged, In Progress, Resolved, etc.) is managed separately from the events that triggered it.
This is actually a critical feature. Events are just log entries—they don't have "statuses" in the workflow sense. Incidents are workflow objects that track your investigation and response process. You might have an incident in "Resolved" status while the original events remain unchanged in the logs. The incident lifecycle is about your response process, not the underlying data.
❌ C. Severity incidents rated with the level High have an initial service-level agreement (SLA) response time of 1 hour.
Wrong. SLA response times are not hardcoded by FortiAnalyzer based on severity levels. You configure your own SLA policies based on your organization's requirements.
While you can certainly set a 1-hour SLA for high-severity incidents if that fits your needs, FortiAnalyzer doesn't impose this automatically. Different organizations have different response requirements. Some might need 15-minute response times for critical incidents, others might set 2 hours. It's fully customizable, not a fixed system default.
❌ D. Incidents must be acknowledged before they can be analyzed.
Wrong. You don't need to acknowledge an incident before analyzing it. Acknowledgment is a workflow step that indicates someone is taking ownership, but it's not a technical requirement that blocks analysis.
You can view incident details, examine associated events, run queries, and perform analysis on incidents in "New" status without acknowledging them first. Acknowledgment is about workflow management and accountability (showing that someone is handling it), not a gatekeeper for investigation capabilities. This misconception probably comes from thinking incidents work like some ticketing systems that lock features behind status changes.
Reference:
https://docs.fortinet.com
(In a FortiAnalyzer Fabric deployment, which three modules from Fabric members are available for analysis on the supervisor? (Choose three answers))
A. Playbooks
B. Indicators
C. Logs
D. Events
E. Reports
Explanation:
FortiAnalyzer Fabric setups let a central "supervisor" device pull together key data from multiple member FortiAnalyzers, giving you a single pane of glass for oversight without manual log shuffling across devices.
Correct Answers
✅ C. Logs
These are the raw lifeblood—traffic, security, and system records stream from members to the supervisor via fabric connectors. This lets you run cross-device searches and analytics without logging into each unit separately, powering dashboards like FortiView.
✅ D. Events
High-risk incidents (think blocked attacks or policy violations) get correlated and displayed centrally. The supervisor aggregates event handler outputs, so you spot patterns—like repeated malware attempts—across your entire fabric in one view.
✅ E. Reports
Generated PDFs or scheduled outputs from members sync up, allowing the supervisor to compile executive summaries or compliance docs from all sources. No more chasing individual reports; it's all consolidated for easy distribution.
These three shine because the supervisor syncs raw logs, triggered events, and generated reports from all fabric members via API for unified analysis—think centralized dashboards showing threats, incidents, and custom outputs across your entire fleet.
Why Others Are Wrong
❌ A. Playbooks
Playbooks handle automated response workflows, but they stay local to each member's SOC tools; supervisors don't aggregate or execute them cross-fabric. A trap for those mixing up playbook automation with basic data sync.
❌ B. Indicators
Indicators of Compromise (IoCs) live in threat intel feeds or FortiGuard, not routinely synced as fabric modules—supervisors focus on logs/events/reports, skipping these for performance reasons. Easy mix-up if you've seen them in standalone event handlers.
Reference:
https://docs.fortinet.com/product/fortianalyzer/7.6
Which statement about automation connectors in FortiAnalyzer is true?
A. An ADOM with the Fabric type comes with multiple connectors configured.
B. The local connector becomes available after you configured any external connector.
C. The local connector becomes available after you connectors are displayed.
D. The actions available with FortiOS connectors are determined by automation rules configured on FortiGate.
Explanation:
Consider these guiding questions to uncover the truth:
🔹 Where do you go in FortiAnalyzer to see active connectors (hint: Incidents & Events > Automation > Active Connectors)?
🔹 The local connector (for FortiAnalyzer's own built-in actions) — is it something you have to create manually, or does it show up from the start?
🔹 For FortiOS connectors (the ones tied to FortiGate devices), what must happen on the FortiGate side before their actions appear as options in FortiAnalyzer playbooks?
🔹 In a Fabric ADOM versus a regular FortiGate ADOM, do you automatically get a bunch of pre-configured connectors just because of the ADOM type?
Now, let's reason through each option together:
A. An ADOM with the Fabric type comes with multiple connectors configured. ❌
Fabric ADOMs are great for grouping multiple Fabric devices (FortiGate, EMS, etc.), but they don't automatically come with a bunch of pre-configured automation connectors ready to go. Connectors like FortiOS appear only after devices are authorized, FortiGuard needs a license, and others require manual setup or enabling. A common misconception is thinking "Fabric = everything auto-configured"—but it's more about log correlation and visibility than instant connector population.
B. The local connector becomes available after you configured any external connector. ❌
The local connector is the opposite—it's the default one for FortiAnalyzer itself and is available automatically right from the beginning (no external setup required). It provides built-in FortiAnalyzer actions for playbooks. People sometimes assume everything needs configuration first, but the local one is always there as the foundation.
C. The local connector becomes available after you connectors are displayed. ❌
This one is a bit circular and vague. The local connector doesn't wait for "other connectors to be displayed"—it's already present and visible in the Active Connectors list by default. No dependency on other connectors showing up first.
D. The actions available with FortiOS connectors are determined by automation rules configured on FortiGate. ✅
This hits the key behavior spot-on. For FortiOS connectors (which appear after authorizing at least one FortiGate in the ADOM), the actual actions you can select in FortiAnalyzer playbooks come directly from the automation rules you create on the FortiGate(s) themselves—specifically those using the Incoming Webhook trigger. Those rules must exist and be enabled on FortiOS (under Security Fabric > Automation) before they show up as callable actions in FortiAnalyzer. It's a beautiful two-way integration: FortiGate defines what it can do when called, and FortiAnalyzer orchestrates it.
Reference:
https://docs.fortinet.com/product/fortianalyzer
You created a playbook on FortiAnalyzer that uses a FortiOS connector.
When configuring the FortiGate side, which type of trigger must be used so that the actions in an automation
stich are available in the FortiOS connector?
A. FortiAnalyzer Event Handler
B. Fabric Connector event
C. FortiOS Event Log
D. Incoming webhook
Explanation:
This question is about how FortiAnalyzer playbooks are triggered from the FortiGate side when you use a FortiOS connector. The key idea is that FortiAnalyzer does not passively listen for FortiGate automation events. Instead, FortiGate must explicitly call FortiAnalyzer using a specific trigger type so that FortiAnalyzer can run the playbook and expose its actions to FortiOS.
✅ Correct Answer: D. Incoming webhook
When you create a playbook in FortiAnalyzer and expose it through a FortiOS connector, FortiGate must use an Incoming webhook as the trigger in its automation stitch.
Why this matters:
✔️ The FortiOS connector in FortiAnalyzer is designed to be invoked externally
✔️ FortiGate triggers the playbook by sending an HTTP request to FortiAnalyzer
✔️ Only the Incoming webhook trigger allows FortiGate to call FortiAnalyzer and make the playbook actions available for use in the automation stitch
In short: webhooks are the bridge between FortiGate automation and FortiAnalyzer playbooks.
❌ Incorrect Options
A. FortiAnalyzer Event Handler
Event handlers are internal to FortiAnalyzer. They react to logs and events already stored in FortiAnalyzer and cannot be used to expose playbook actions to FortiOS. This option confuses where the logic runs.
B. Fabric Connector event
Fabric Connector events are used to react to external Fabric sources such as cloud services. They are not designed to trigger FortiAnalyzer playbooks from FortiGate automation stitches.
Common misconception: Thinking any “connector” event works bidirectionally. It doesn’t.
C. FortiOS Event Log
FortiOS Event Log triggers are log-based and operate entirely inside FortiGate. They do not call FortiAnalyzer or interact with FortiAnalyzer playbooks in any way.
Key flaw: No outbound communication to FortiAnalyzer.
Reference:
Fortinet Documentation
Exhibit.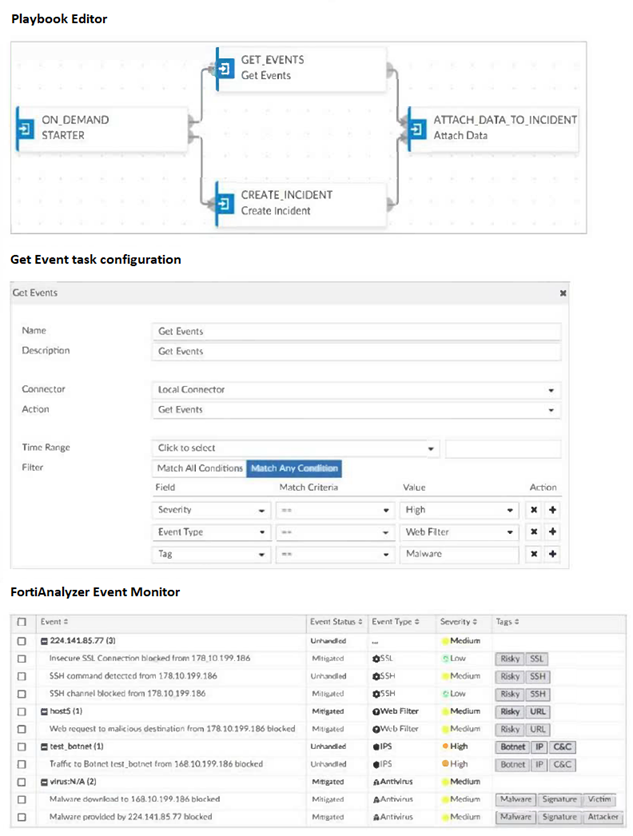
Assume these are all the events that exist on the FortiAnalyzer device.
How many events will be added to the incident created after running this playbook?
A. Eleven events will be added.
B. Seven events will beadded
C. No events will be added.
D. Four events will be added.
Explanation:
Analyzing the Filter Logic:
The "Get Events" task in the playbook is configured with a filter that uses Match All Conditions. This is a logical AND. For an event to be selected by this task and later attached to the incident, it must satisfy ALL of these three conditions simultaneously:
Severity == High
Event Type == Web Filter
Tag == Malware
If an event fails any one of these conditions, it is excluded.
Cross-Referencing with the Event List:
Let's examine each event in the FortiAnalyzer Event Monitor table against the three filter criteria.
| Event Description | Severity | Event Type | Tags | Passes Filter? | Why? |
|---|---|---|---|---|---|
| 224.141.85.77 (3) | Medium | -- | Risky SSL | ❌ | Fails Severity (not High) and Event Type. |
| Insecure SSL Connection blocked... | Low | OSSL | Risky SSL | ❌ | Fails Severity and Event Type. |
| SSH command detected... | Medium | OSSH | Risky SSH | ❌ | Fails Severity and Event Type. |
| SSH channel blocked... | Low | OSSH | Risky SSH | ❌ | Fails Severity and Event Type. |
| host5 (1) | Medium | OWeb Filter | Risky URL | ❌ | Fails Severity (not High) and Tag (not Malware). |
| Web request to malicious destination... | Medium | OWeb Filter | Risky URL | ❌ | Fails Severity (not High) and Tag (not Malware). |
| test_botnet (1) | High | IIPS | Botnet IP C&C | ❌ | Fails Event Type (not Web Filter) and Tag. |
| Traffic to Botnet test_botnet... | High | IIPS | Botnet IP C&C | ❌ | Fails Event Type (not Web Filter) and Tag. |
| virus:N/A (2) | Medium | AAntivirus | Malware | ❌ | Fails Severity (not High) and Event Type. |
| Malware download to... blocked | Medium | AAntivirus | Malware Signature Victim | ❌ | Fails Severity (not High), Event Type, and Tag (not "Malware"). |
| Malware provided by... blocked | Medium | AAntivirus | Malware Signature Attacker | ❌ | Fails Severity (not High), Event Type, and Tag (not "Malware"). |
(Which two statements about FortiAnalyzer Fabric deployments are true? (Choose two answers))
A. Supervisors can be in high availability (HA) for redundancy purposes only.
B. Fabric members can operate in analyzer mode only.
C. Fabric members do not forward their logs to the supervisor.
D. Supervisors and members must be in the same time zone.
Explanation:
The FortiAnalyzer Fabric is a "manager of managers" architecture designed for very large environments. Instead of having one massive FortiAnalyzer trying to handle every log and every report, you split the work.
🔹 Members: These are the "workers." They sit in different locations, collect logs from local devices (FortiGates), and do the heavy lifting of processing and indexing that data.
🔹 Supervisor: This is the "boss." It doesn't collect logs itself. Instead, it provides a single pane of glass where an analyst can log in and see a unified view of FortiView, Log View, and Incidents from all the members at once.
✅ Option B: Fabric members can operate in analyzer mode only. To participate in a Fabric, a FortiAnalyzer member must be in Analyzer mode. This is because the Fabric's purpose is to aggregate security intelligence and analytics. A device in Collector mode is designed only to receive and forward raw logs; it doesn't build the SQL databases or run the analytics that the Supervisor needs to pull data for its centralized dashboards.
✅ Option C: Fabric members do not forward their logs to the supervisor. This is a common point of confusion. In a Fabric deployment, logs stay where they are. The members keep their logs locally. When a user logs into the Supervisor to run a report or check FortiView, the Supervisor sends a query to the members and "borrows" their data to show it to you. This saves a massive amount of network bandwidth because raw logs aren't being double-sent over the WAN.
❌ Option A: Supervisors can be in high availability (HA) for redundancy purposes only. This statement is incorrect because HA is not supported for the Supervisor role in a FortiAnalyzer Fabric. While Members can (and should) be in HA clusters to ensure they don't stop collecting logs, the Supervisor is currently a standalone role. If the Supervisor fails, the members keep working and collecting logs—you just lose the centralized "single pane" view until the Supervisor is back online.
❌ Option D: Supervisors and members must be in the same time zone. Actually, they can be in different time zones! This is one of the strengths of the Fabric. A member in London and a member in New York can both report to a Supervisor in Tokyo. The Supervisor is smart enough to handle the time differences; typically, when you view data on the Supervisor, it displays it based on the Supervisor's local time (or the time zone configured in your admin profile) so the timeline makes sense to the analyst.
Teacher's Tip for the Exam
Remember the "Don't Move the Data" rule for Fabric. Unlike "Log Forwarding" or "Aggregation Mode" where logs physically move from one box to another, the Fabric leaves the logs on the members and just moves the view of the data to the supervisor.
Reference:
Official Fortinet Documentation
Which log will generate an event with the status Contained?
A. An AV log with action=quarantine.
B. An IPS log with action=pass.
C. A WebFilter log will action=dropped.
D. An AppControl log with action=blocked.
Explanation:
In FortiAnalyzer, the “Contained” status is reserved for events where a threat has been successfully isolated or neutralized without allowing it to propagate or cause harm. This typically applies to antivirus (AV) actions that quarantine malicious files—effectively “containing” the threat. Other actions like blocking traffic (IPS, WebFilter, AppControl) are considered “Handled”, but not “Contained,” because they prevent access rather than isolate an actual payload.
Think of “Contained” as putting a virus in a sealed lab container—still present, but safely locked away. That’s exactly what quarantine does.
Correct Answer
✅ A. An AV log with action=quarantine.
When FortiGate’s antivirus engine detects a malicious file and quarantines it, the file is copied to a secure, isolated location and prevented from executing or spreading. In FortiAnalyzer, this action generates an event with the status “Contained”, reflecting that the threat was captured and neutralized at the file level—not just blocked at the network layer.
➡️ This is a key distinction: quarantine = containment, whereas block/drop = handling.
Incorrect Answers
❌ B. An IPS log with action=pass.
As discussed previously, action=pass means the IPS detected a signature but took no action—traffic was allowed. This results in an “Unhandled” status, not “Contained.” There’s no isolation or mitigation here, so containment doesn’t apply.
❌ C. A WebFilter log with action=dropped.
Web filtering blocks access to a URL or category by dropping the connection. While effective, this is a network-level block, not file-level isolation. FortiAnalyzer classifies this as “Handled”, because the policy was enforced—but nothing was “contained” (no file or object was captured and stored).
💡 Common mix-up: People sometimes equate “blocked” with “contained,” but in Fortinet’s terminology, containment implies physical or logical isolation of a threat artifact, not just denying a request.
❌ D. An AppControl log with action=blocked.
Application Control blocks specific apps (e.g., Skype, BitTorrent) by preventing their traffic. Again, this is a policy enforcement action at the session level. The app isn’t “contained”—it’s simply denied. Thus, the event status is “Handled”, not “Contained.”
Key Takeaway
Only antivirus quarantine actions produce the “Contained” status in FortiAnalyzer. This reflects Fortinet’s precise event classification model:
🔹 Contained → Threat artifact isolated (file quarantined)
🔹 Handled → Traffic blocked or reset (IPS, WebFilter, AppControl)
🔹 Unhandled → Detection without action (e.g., IPS in pass mode)
Understanding these nuances helps you interpret security events accurately during investigations or compliance audits.
Reference:
Fortianalyzer 7.6
| Page 3 out of 10 Pages |
| 12345 |
| FCP_FAZ_AN-7.6 Practice Test Home |
Choosing the right preparation material is critical for passing the Fortinet NSE 5 FortiAnalyzer 7.6 Analyst exam. Here’s how our FCP_FAZ_AN-7.6 practice test is designed to bridge the gap between knowledge and a passing score.
Copyright © - All Rights Reserved