
Last Updated On : 12-Oct-2026
Total 91 Questions
SOC Features, Incidents, and Automation
Refer to Exhibit:
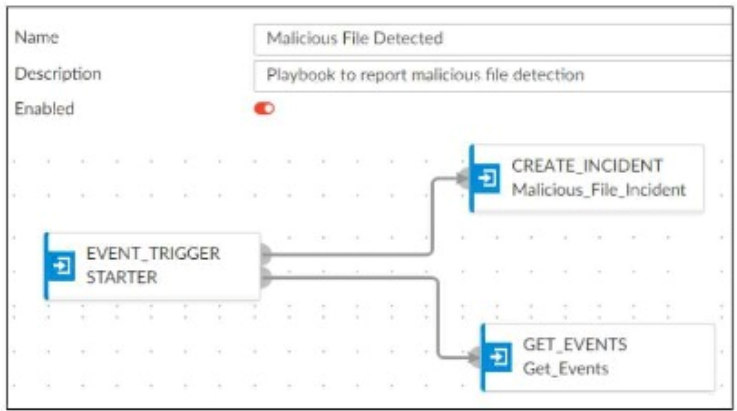
A SOC analyst is creating the Malicious File Detected playbook to run when FortiAnalyzer generates a
malicious file event. The playbook must also update the incident with the malicious file event data.
What must the next task in this playbook be?
A. A local connector with the action Update Asset and Identity
B. A local connector with the action Attach Data to Incident
C. A local connector with the action Run Report
D. A local connector with the action Update Incident
Explanation:
This question evaluates your understanding of the logical flow required in a FortiAnalyzer playbook to automate incident enrichment. The objective is to ensure that the specific event data triggering the playbook is not just identified but actively linked to the newly created incident record for investigation.
✅ Correct Option:
✅ B. A local connector with the action Attach Data to Incident:
In the exhibit, the playbook has already initiated the "CREATE_INCIDENT" and "GET_EVENTS" tasks. To fulfill the requirement of updating the incident with the malicious file event data, the next logical step is to use the "Attach Data to Incident" action. This connector bridges the gap between the retrieved event logs and the incident container, ensuring all relevant forensic evidence is automatically attached and visible within the incident's management tab.
❌ Incorrect options:
❌ A. A local connector with the action Update Asset and Identity:
This action is used to refresh information about devices or users within the Fabric's asset database. While identifying the host that downloaded the malicious file is part of an investigation, this specific action does not satisfy the requirement of linking the "malicious file event data" to the incident record itself.
❌ C. A local connector with the action Run Report:
The "Run Report" action triggers the generation of a pre-defined PDF or HTML document. While reports provide historical summaries, they are not used as a dynamic playbook step to attach real-time event data to a specific incident record. This action would be more appropriate for end-of-week summaries rather than immediate incident enrichment.
❌ D. A local connector with the action Update Incident:
The "Update Incident" action is primarily used to modify administrative metadata, such as changing the incident status to "In Progress," adjusting the severity level, or assigning the case to a specific SOC analyst. It does not possess the specific functional mapping required to ingest and attach raw event data or log evidence to the incident.
🔧 Reference:
→ FortiAnalyzer Playbook Tasks and Actions
This official documentation describes how the "Attach Data to Incident" task functions as the primary method for enriching incidents with event-specific evidence in a playbook workflow.
Refer to the exhibits.
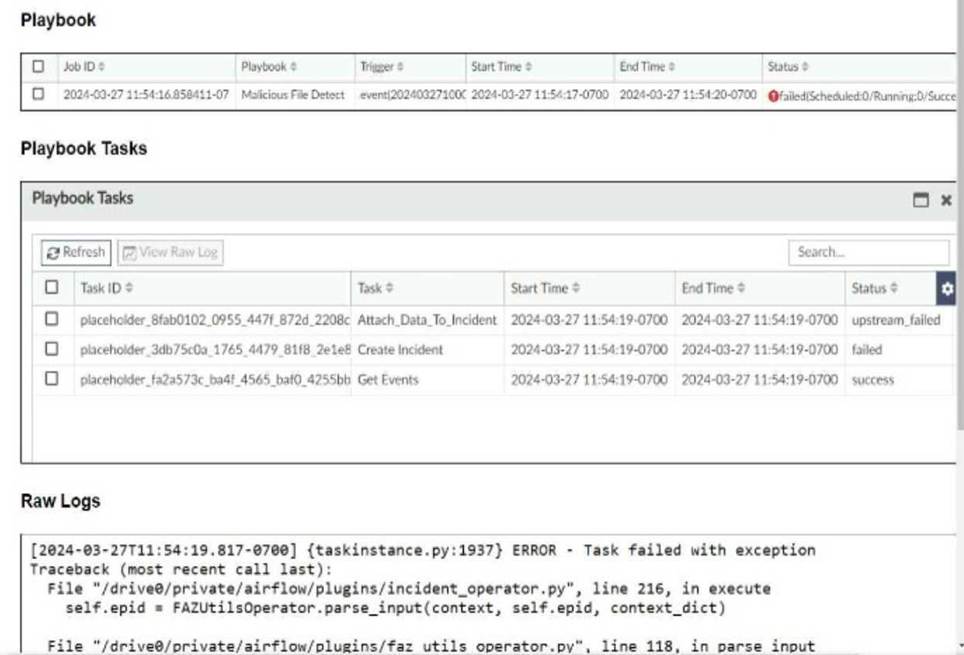
The Malicious File Detect playbook is configured to create an incident when an event handler generates a
malicious file detection event.
Why did the Malicious File Detect playbook execution fail?
A. The Create Incident task was expecting a name or number as input, but received an incorrect data format
B. The Get Events task did not retrieve any event data.
C. The Attach_Data_To_lncident incident task wasexpecting an integer, but received an incorrect data format.
D. The Attach Data To Incident task failed, which stopped the playbook execution.
Explanation:
This question tests your ability to interpret FortiAnalyzer playbook execution logs and task status results. The exhibit shows three tasks with distinct statuses — Get Events (success), Create Incident (failed), and Attach_Data_To_Incident (upstream_failed). The raw log error traceback in incident_operator.py with FAZUtilsOperator.parse_input directly identifies where and why the failure occurred.
✔️ Correct Answer:
A. The Create Incident Task Was Expecting a Name or Number as Input, but Received an Incorrect Data Format
The raw log traceback points to incident_operator.py line 216 where self.epid = FAZUtilsOperator.parse_input(context, self.epid, context_dict) failed. This confirms the Create Incident task encountered a data format mismatch — it expected a valid name or numeric identifier (epid) but received incompatible input. This caused Create Incident to fail, which in turn caused Attach_Data_To_Incident to report upstream_failed.
❌ Incorrect Answers:
B. The Get Events Task Did Not Retrieve Any Event Data
The Playbook Tasks table explicitly shows Get Events status as "success", meaning event data was retrieved successfully. This option is directly contradicted by the exhibit. The failure did not originate from Get Events — it occurred in the downstream Create Incident task that processed the retrieved data.
C. The Attach_Data_To_Incident Task Was Expecting an Integer, but Received an Incorrect Data Format
The status of Attach_Data_To_Incident is "upstream_failed" — not "failed." This means it never even executed; it was blocked because the Create Incident task before it had already failed. The error traceback in the raw logs also points exclusively to the incident_operator, not to the Attach Data task.
D. The Attach Data To Incident Task Failed, Which Stopped the Playbook Execution
This reverses the actual failure sequence. The Attach_Data_To_Incident task shows "upstream_failed" status, meaning it was never executed due to the prior failure of Create Incident. It did not independently fail or stop the playbook — it was simply prevented from running by the upstream error.
🔧 Reference:
→ FortiAnalyzer 7.6.0 Administration Guide – Playbook Monitor
Confirms how the Playbook Monitor displays task-level statuses including "failed" and "upstream_failed", and how failed tasks cascade through the playbook execution chain.
→ FortiAnalyzer 7.6.4 Administration Guide – Raising an Incident
Confirms the Create Incident action's required input fields — including the Affected Endpoint (epid) — and how an incorrectly formatted input value causes the task to fail during playbook execution.
Refer to the exhibit.
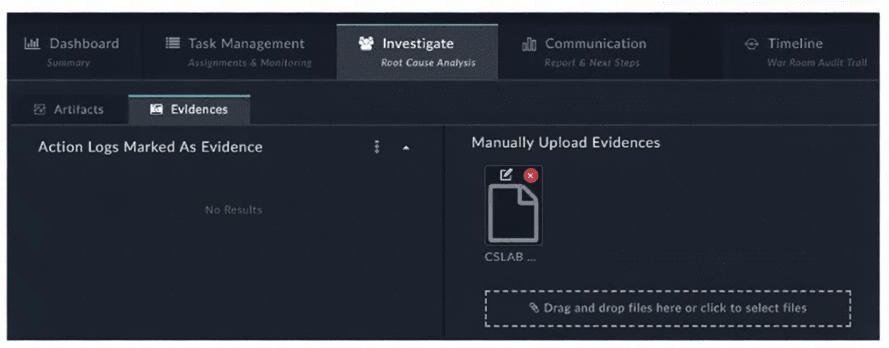
How do you add a piece of evidence to the Action Logs Marked As Evidence area? (Choose one answer)
A. By tagging output or a workspace comment with the keyword Evidence
B. By linking an indicator to the war room
C. By creating an evidence collection task and attaching a file
D. By executing a playbook with the Save Execution Logs option enabled
Explanation:
The question checks how FortiSOAR’s War Room “Evidences” tab captures action logs automatically. It tests knowledge that specific log entries are promoted to the “Action Logs Marked As Evidence” list when an analyst tags a playbook step output or a War Room comment with the keyword Evidence, rather than by manual upload or unrelated actions.
✔️ Correct Option: A. By tagging output or a workspace comment with the keyword Evidence
Tagging a playbook step’s output or a War Room (workspace) comment with the word Evidence flags that entry. FortiSOAR then automatically copies the corresponding action log into the “Action Logs Marked As Evidence” section under Investigate → Evidences, creating an auditable trail without manual file upload.
❌ Incorrect Option: B. By linking an indicator to the war room.
Linking an indicator associates threat intel with the investigation but does not mark action logs as evidence. Indicators appear under Artifacts/Observables, not under “Action Logs Marked As Evidence,” so this action won’t populate that section.
❌ Incorrect Option: C. By creating an evidence collection task and attaching a file.
Creating a task and attaching a file uploads evidence to the “Manually Upload Evidences” pane on the right, not the “Action Logs Marked As Evidence” list on the left. It handles files, not action log entries.
❌ Incorrect Option: D. By executing a playbook with the Save Execution Logs option enabled.
Saving execution logs retains full run history for debugging, but it doesn’t selectively mark entries as evidence. Without the Evidence tag, those logs remain in the timeline and are not promoted to the evidence list.
🔧 Reference:
→ Working with Modules — Alerts & Incidents — Describes War Room evidence handling, including tagging outputs/comments with the Evidence keyword to mark action logs as evidence.
A customer wants FortiAnalyzer to run an automation stitch that executes a CLI command on FortiGate to
block a predefined list of URLs, if a botnet command-and-control (C&C) server IP is detected.
Which FortiAnalyzer feature must you use to start this automation process?
A. Playbook
B. Data selector
C. Event handler
D. Connector
Explanation:
This question tests how automation is triggered in FortiAnalyzer. The scenario requires detecting a specific security event (botnet C&C IP) and then initiating an automated response. The key is identifying which component is responsible for detecting conditions and triggering actions.
🟢 Correct Option:
C. Event handler
Event handlers in FortiAnalyzer are used to define conditions based on logs and detect security events such as botnet C&C communication. When the defined condition is met, the event handler triggers an action, such as launching an automation stitch or playbook. This makes it the correct feature to initiate the automation process based on detected threats.
🔴 Incorrect Options:
A. Playbook
A playbook defines the sequence of automated actions but does not independently detect events. It requires a trigger, such as an event handler, to start execution. Without a triggering mechanism, a playbook cannot initiate automation on its own.
B. Data selector
A data selector is used to filter and retrieve logs for analysis or reporting. It does not perform detection or trigger automation workflows, so it cannot initiate an automation stitch based on security events.
D. Connector
A connector integrates FortiAnalyzer with external systems or devices. While it enables communication, it does not detect events or trigger automation. It is not responsible for starting automation processes.
🔧 Reference:
→ FortiAnalyzer Event Handler Documentation
Confirms event handlers detect log-based conditions and trigger automation actions such as playbooks or stitches.
Refer to the exhibits.
You configured a spearphishing event handler and the associated rule. However. FortiAnalyzer did not
generate an event.
When you check the FortiAnalyzer log viewer, you confirm that FortiSandbox forwarded the appropriate logs,
as shown in the raw log exhibit.
What configuration must you change on FortiAnalyzer in order for FortiAnalyzer to generate an event?
A. In the Log Type field, change the selection to AntiVirus Log(malware).
B. Configure a FortiSandbox data selector and add it tothe event handler.
C. In the Log Filter by Text field, type the value: .5 ub t ype ma Iwa re..
D. Change trigger condition by selecting. Within a group, the log field Malware Kame (mname> has 2 or more unique values.
Explanation:
🔍 Concept summary
This question tests how FortiAnalyzer event handlers actually match logs. Even when logs are present in the log viewer, FortiAnalyzer will not generate an event unless the event handler is explicitly linked to the correct log source. Seeing logs is not enough. The event handler must be told which device and log type to evaluate.
The core issue here is missing log selection, not filtering logic or trigger conditions.
✅ Correct answer: B. Configure a FortiSandbox data selector and add it to the event handler.
FortiSandbox logs are not evaluated by default unless you explicitly include them using a data selector.
In this case:
Exhibit:
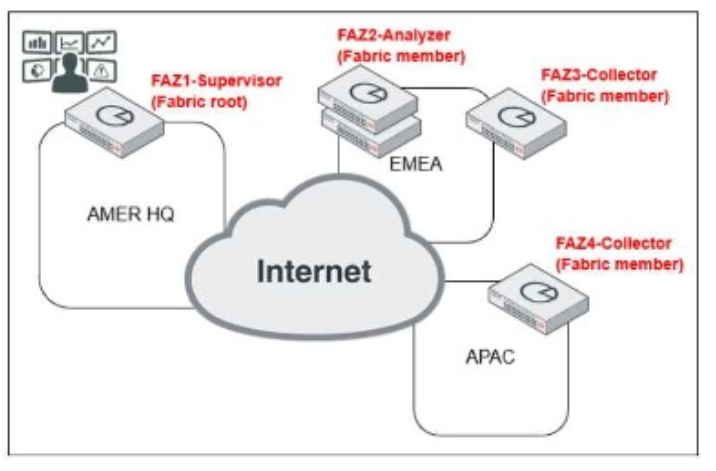
Which observation about this FortiAnalyzer Fabric deployment architecture is true?
A. The AMER HQ SOC team cannot run automation playbooks from the Fabric supervisor.
B. The AMER HQ SOC team must configure high availability (HA) for the supervisor node.
C. The EMEA SOC team has access to historical logs only.
D. The APAC SOC team has access to FortiView and other reporting functions.
Explanation:
This question tests your understanding of FortiAnalyzer Fabric role limitations in a multi-tier, multi-region deployment. The exhibit shows FAZ1-Supervisor in AMER HQ as the Fabric root, FAZ2-Analyzer and FAZ3-Collector in EMEA, and FAZ4-Collector in APAC. Each node has specific capabilities and restrictions that determine what each regional SOC team can and cannot perform.
✔️ Correct Answer:
A. The AMER HQ SOC Team Cannot Run Automation Playbooks from the Fabric Supervisor
The FortiAnalyzer 7.6 Architecture Guide explicitly states the multi-tier Fabric is unable to perform configuration changes or run automation playbooks from the Fabric supervisor to members. Fortinet FAZ1 in AMER HQ is the supervisor/root node — the SOC team has centralized visibility but is architecturally restricted from executing playbook automation across Fabric members from this node.
❌ Incorrect Answers:
B. The AMER HQ SOC Team Must Configure High Availability (HA) for the Supervisor Node
The FortiAnalyzer 7.6 Architecture Guide confirms there is no high availability on the supervisor, and scalability and redundancy are limited to each individual FortiAnalyzer deployment. Fortinet HA is neither required nor supported for the supervisor node in this architecture.
C. The EMEA SOC Team Has Access to Historical Logs Only
The EMEA region has FAZ2-Analyzer operating in full Analyzer mode as a Fabric member. An Analyzer mode FortiAnalyzer provides complete functionality including real-time analytics, FortiView, and reporting — not just historical logs. Historical log access only applies to Collector-mode devices, not Analyzers.
D. The APAC SOC Team Has Access to FortiView and Other Reporting Functions
The APAC region only has FAZ4-Collector, which operates in Collector mode. Collector mode devices are limited to receiving and forwarding logs to an Analyzer. FortiView, dashboards, and reporting features are exclusive to Analyzer mode and are not available on a Collector-only deployment like FAZ4.
🔧 Reference:
→ FortiAnalyzer 7.6.0 Architecture Guide – Multiple Tiers FortiAnalyzer Fabric
Directly and explicitly confirms: no HA on the supervisor, and the Fabric supervisor is unable to run automation playbooks on member devices — validating Answer A and invalidating Answer B.
→ FortiAnalyzer 7.6.2 Administration Guide – Analyzer and Collector feature comparison
Confirms that Collector mode devices do not support FortiView or reporting, directly invalidating Answer D for the APAC FAZ4-Collector node.
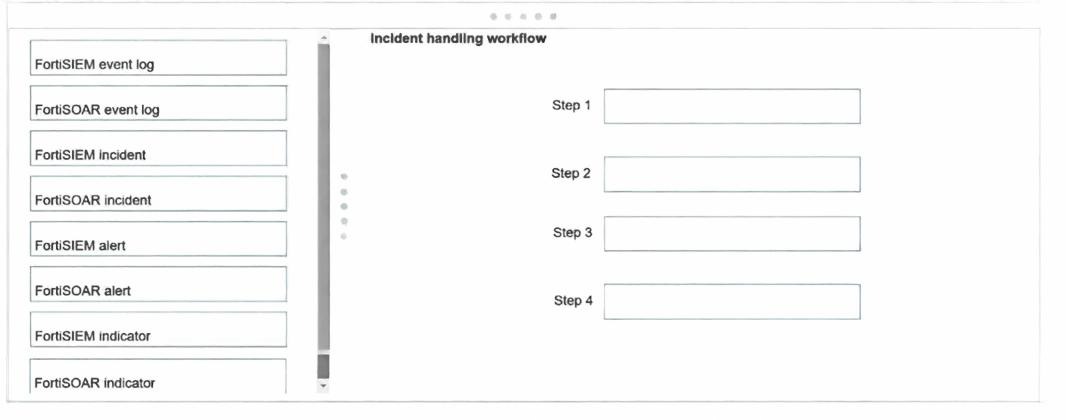
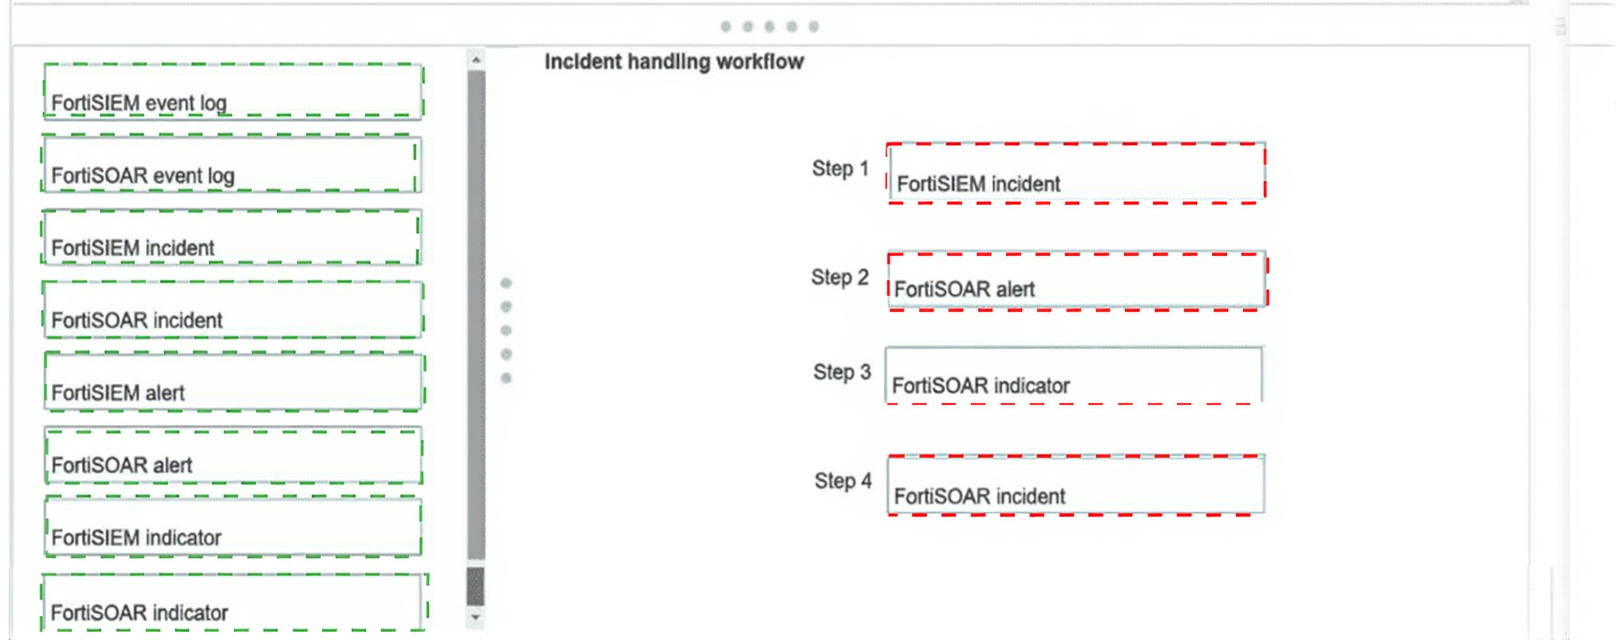
Using the default data ingestion wizard in FortiSOAR, place the incident handling workflow from FortiSIEM
to FortiSOAR in the correct sequence. Select each workflow component in the left column, hold and drag it to
a blank position in the column on the right. Place the four correct workflow components in order, placing the
first step in the first position at the top of the column.
Explanation:
This question tests the default incident handling workflow when ingesting data from FortiSIEM into FortiSOAR using the standard Data Ingestion Wizard. The process follows a logical progression: pulling a security finding from the SIEM, representing it as an alert, extracting relevant artifacts as indicators, and finally escalating confirmed threats into incidents .
✔️ Correct Options:
Step 1 (FortiSIEM incident):
The Data Ingestion Wizard pulls security findings from FortiSIEM. The connector maps native "incidents" in FortiSIEM directly to records in FortiSOAR .
Step 2 (FortiSOAR alert):
Once ingested, the FortiSIEM incident is converted into an alert record in FortiSOAR. This is the first-class object representing a potential security issue .
Step 3 (FortiSOAR indicator):
Upon alert creation, automated playbooks extract observables (like IPs or hashes) from the alert and create indicator records for enrichment and reputation checking .
Step 4 (FortiSOAR incident):
After investigation, if the alert is a true positive, the analyst escalates it. Related alerts are grouped into an incident for formal tracking, SLA management, and response .
❌ Incorrect options:
FortiSIEM alert:
FortiSIEM uses the term "incident" as its primary security finding; "alert" in FortiSIEM is not the primary object ingested by the default wizard .
FortiSOAR event log:
This represents raw, unparsed log data. The workflow starts with structured security findings, not raw logs.
FortiSIEM indicator:
Indicators are extracted within FortiSOAR after ingestion, not before. FortiSIEM does not send pre-packaged indicators in this default workflow.
FortiSIEM event log:
Similar to event log, this is too low-level. The ingestion wizard is designed to pull analyzed incidents, not raw events.
🔧 Reference:
→ Fortinet Documentation: About the connector
Confirms that "incidents" in FortiSIEM are mapped to "alerts" in FortiSOAR during data ingestion.
→ Fortinet Documentation: Streamline
Describes how alerts are escalated into incidents for response.
| Page 4 out of 13 Pages |
| 1234567 |
| NSE7_SOC_AR-7.6 Practice Test Home |
The Fortinet NSE 7 - Security Operations 7.6 Architect exam is notoriously tough. It doesn't test memorization. It forces you to make complex decisions under time pressure. A weak prep strategy risks a costly failure and wasted effort. Our NSE7_SOC_AR-7.6 practice tests are built to be your definitive bridge to a passing score.

Copyright © - All Rights Reserved